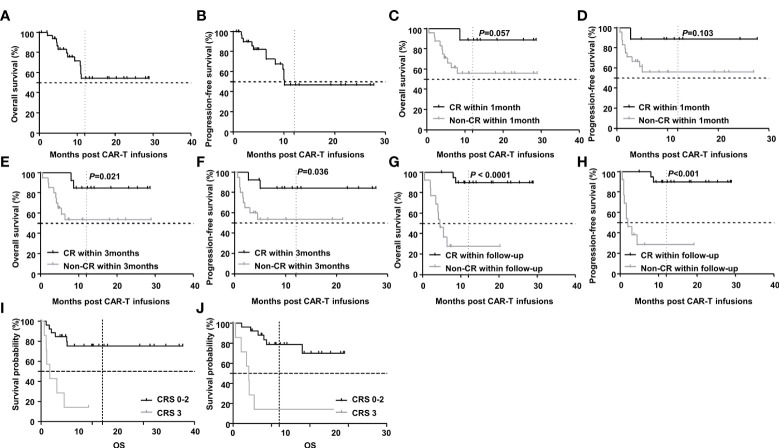
Figure 4.
Survival after CAR-T therapy in R/R DLBCL patients. (A, B) OS and PFS curves of all patients after CAR-T therapy and the 2-year OS and PFS rates were 54.3% and 47.2% respectively (n=33). (C, D) OS and PFS curves of patients in cases who achieved CR within 1 month and those who did not. The 2-year OS and PFS in both groups were undefined and undefined (n1=9, n2=24, P=0.057 and P=0.103 respectively). (E, F) The 2-year OS and PFS curves of patients in cases who achieved CR within 3 months and those who did not. The 2-year OS and PFS in both groups were undefined and undefined (n1=13, n2=20, P=0.021 and P=0.036 respectively). (G, H) The 2-year OS and PFS curves of patients in cases who achieved CR during the follow-up period and those who did not. The 2-year OS and PFS in both groups were undefined versus 4.6 months (n1=20, n2=13, P < 0.0001) and undefined versus 2.0 months (n1=20, n2=13, P<0.001). (I, J) The 2-year OS and PFS curves of patients with grade 3 CRS and those with grade 0-2 CRS. The 2-year OS and PFS in both groups were 4.1 months versus undefined (n1=7, n2=26, P< 0.0001) and 1.7 months versus undefined (n1=7, n2=26, P=0.0002). Note: OS for overall survival; PFS for progression-free survival.

