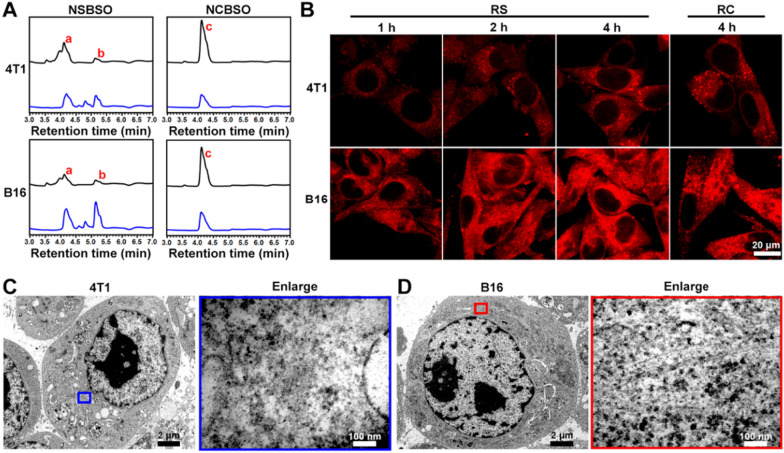
Fig. 3.
Intracellular GSH-responsive transformation. A LC–MS traces of the cellular uptake and transformation of 100 μM NSBSO and NCBSO after incubation with 4T1 and B16 cells for 10 h (black lines indicate culture medium, blue lines indicate cell lysates). B CLSM images of 4T1 and B16 cells treated with RS or RC (100 μM). C, D Bio-TEM image of 4T1 cell and corresponding higher-magnification image of the blue-framed area, and B16 cell and corresponding higher-magnification image of the red-framed area after 4-h treatment of NSBSO treatment (100 μM for 4T1 cells, 10 μM for B16 cells). The red a, b and c in (A) represents NSBSO, Nap-DFDFY-thiol and NCBSO, respectively

