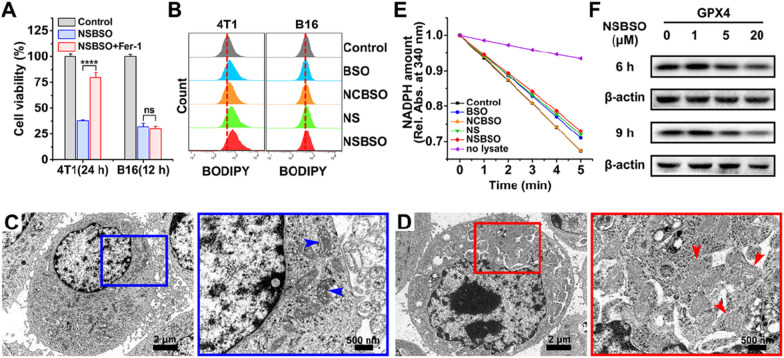
Fig. 4.
Ferroptosis of 4T1 cells induced by NSBSO and the mechanism study. A The cell viability of 4T1 and B16 cells treated with NSBSO in the presence or absence of ferroptosis inhibitor (Fer-1, 0.5 μM) (Data are presented as mean ± SD, n = 4; ****P < 0.0001). B Flow cytometry analysis of BODIPY dye-stained 4T1 and B16 cells treated with different formulations (10 μM, 10 h). C, D Bio-TEM images of (C) an untreated 4T1 cell and (D) NSBSO treated 4T1 cell, and corresponding higher-magnification images of the blue and red boxes (arrowheads indicate mitochondria). E The GPX activity of 4T1 cells measured by the relative absorbance of NADPH reduction at 340 nm (10 μM, 6 h). F The expression level of GPX4 in 4T1 cells treated with different times and different concentrations of NSBSO

