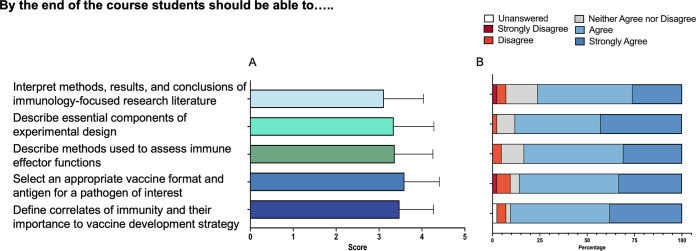
FIG 2.
Instructor and student assessment of student learning. Graphs of student learning as assessed by instructor (A) or students (B). (A) Student learning was evaluated via rubric-based scores on their final project. Class mean score for each learning objective is graphed, and error bars represent the standard deviation (n = 44). (B) Students were asked to self-assess their learning. An end-of-course survey asked students to select whether they strongly agreed (dark blue), agreed (light blue), neither disagreed nor agreed (gray), disagreed (light red), or strongly disagreed (dark red) with the statement “After taking this course, I am able to…” regarding each learning objective (n = 42).

