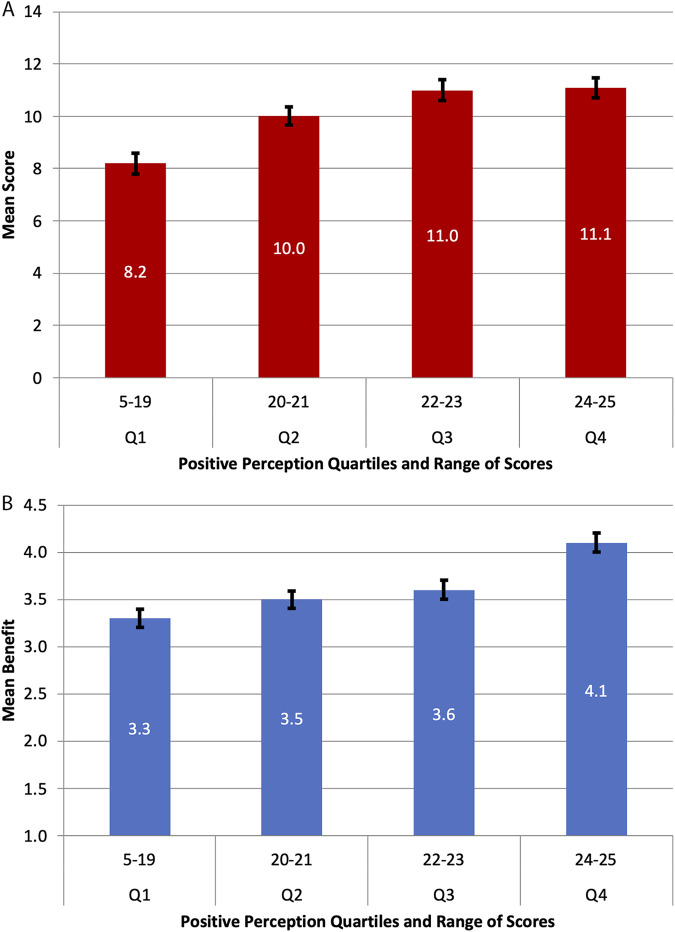
FIG 1.
Positive perceptions of science scores differentiate outcome measures. (A and B) The postcourse positive perceptions of science scores were grouped into quartiles to examine the postcourse quiz scores (A) and the postcourse self-reported mean benefits derived from the student survey (B). For each figure, the x axis shows the four quartiles with the range of perceptions scores shown below the bars. (A) A one-way between-groups ANOVA test was performed using the mean quiz scores grouped by positive perceptions quartiles. The result yielded a significant difference between groups (F = 39.1; df = 3, 984; P < 0.001; r2 = 0.10). Pairwise comparisons analyzed via the Tukey honestly significant difference (HSD) test showed that the mean quiz scores for students in quartiles 3 and 4 did not differ from each other, but both were significantly higher than quiz scores for students in quartiles 1 and 2. The mean quiz scores for quartile 2 were significantly higher than the mean quiz scores for quartile 1 (P < 0.05). Error bars represent 2 standard errors of the mean (SEM). (B) A one-way between-groups ANOVA test was performed using the mean self-reported benefits from the postcourse survey grouped by positive perceptions quartiles. The result yielded a significant difference between groups (F = 51.5; df = 3, 1,040; P < 0.001; r2 = 0.13). Pairwise comparisons made with the Tukey HSD test indicated that the mean self-reported benefits for students in quartile 4 were significantly higher than those for students in the other three groups. The means for students in quartiles 3 and 2 were higher than those for quartile 1 students (P < 0.05), but groups 2 and 3 did not differ from each other. Error bars represent 2 SEM.

