FIG 3.
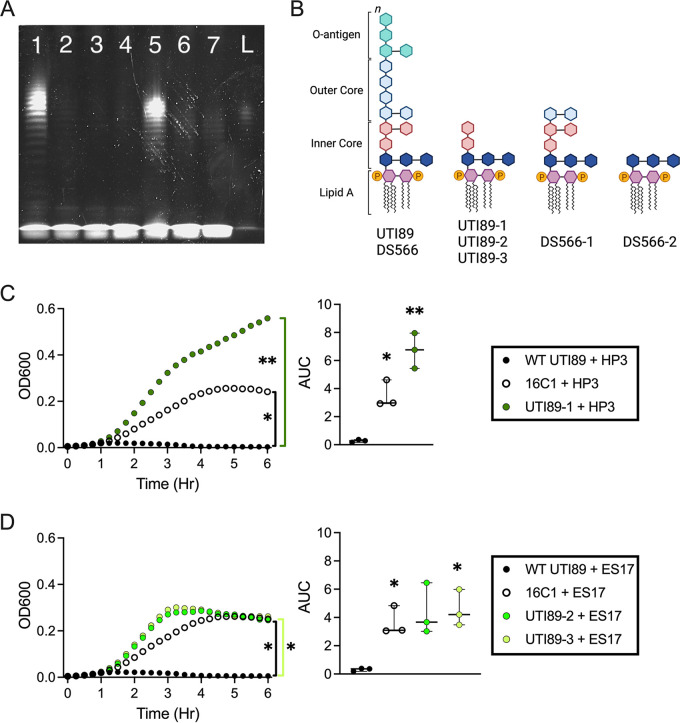
Phage resistance to HP3 and ES17 is associated with LPS deficiency. (A) Representative SDS-PAGE image of WT and phage-resistant UPEC LPS isolated through hot aqueous-phenol extraction and run on a 4% to 12% SDS-polyacrylamide gel loaded with 15 μL of isolated product. Lane 1, WT UTI89; lane 2, UTI89-1; lane 3, UTI89-2; lane 4, UTI89-3; lane 5, WT DS566; lane 6, DS566-1; lane 7, DS566-2; L, LPS standard. Isolation and visualization of LPS was performed in two independent experiments with comparable results. (B) Predicted LPS structures based on gene mutations noted in the sequencing analysis. (C and D) Growth of WT UTI89, rfa transposon mutant 16C1, or phage-resistant UTI89 in the presence of HP3 (C) or ES17 (D) over 6 h. Growth curves of bacteria in the presence of phage are representative of the mean value of three independent experiments, with each performed with four technical replicates. Bars represent median and 95% confidence intervals (CIs). Growth curves were analyzed by repeated measures two-way ANOVA with Geisser-Greenhouse correction and Dunnett’s multiple-comparison test. *, P < 0.05; **, P < 0.01.

