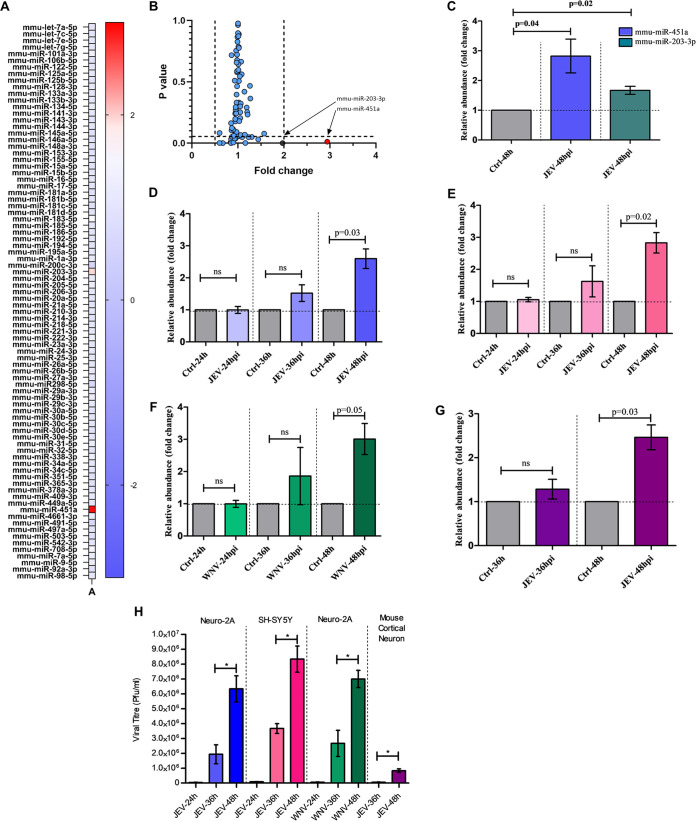
FIG 1.
Neuronal infection by flaviviruses induces upregulation of miR-451a. (A) RNA isolated from JEV-infected Neuro-2a cells at an MOI of 3 for 48 h were subjected to miRNA-qRT-PCR array; the analyzed data have been presented as a heatmap representing fold change obtained for each miRNA. (B) Data from the miRNA-qRT-PCR array plotted with fold change and respective P-values in different axes denoting statistical significance of miR-451a and miR-203-3p upregulation upon JEV infection. (C) miRNA qRT-PCR microarray findings were validated in Neuro-2A cells using qRT-PCR assessing miR-451a abundance in comparison to that of uninfected cells. Time-dependent expression profile of miR-451a upon JEV infection of Neuro-2A cells (D) and SH-SY5Y cells (E) and WNV infection of Neuro-2A cells (F) at an MOI of 3 were evaluated, employing qRT-PCR in comparison to uninfected cells maintained for respective time points. RNA isolated from mouse primary cortical neurons (G) infected by JEV for 36 and 48 h was subjected to qRT-PCR analysis for studying expression kinetics of miR-451a. Each of the qRT-PCR data analyzing miR-451a expression was normalized using SNORD68 snRNA abundance. (H) Supernatant collected from JEV/WNV-infected Neuro-2A, JEV-infected SH-SY5Y, and JEV-infected mouse cortical neuronal culture were collected and subjected to plaque assay for detection of viral growth kinetics. Bar graphs shown in the figure represent data from three biological replicates in the form of mean ± SD. Comparisons between uninfected and respective infected samples were performed using Student's t test with individual P-values indicated in the figures. *, P < 0.05, ns= non-significant.

