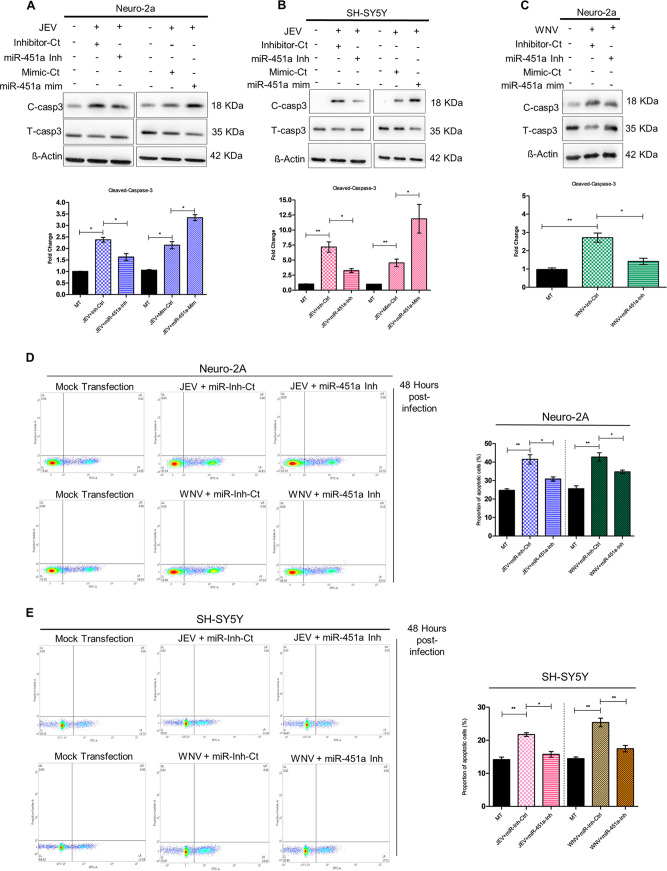
FIG 2.
miR-451a promotes JEV/WNV-induced neuronal apoptosis. Following 24 h of transfection with miR-451a inhibitor (miR-451a-Inh)/miR-451a mimic (miR-451a-mim)/miR inhibitor-control (Inhibitor-Ct)/mimic-control (Mimic-Ct) as indicated in the figure, Neuro-2A (A) and SH-SY5Y (B) cells were infected with JEV for 48 h and WNV (C) for 48 h at MOI 3. Protein isolated from these samples was subjected to immunoblotting analysis for estimation of total- and cleaved-caspase-3 abundance. All the blots presented in the figure represent data from three independent experiments with similar results. ß-actin was used as a loading-control. Molecular weight of protein molecules in Kilodalton (kDa) has been stated beside the respective immunoblots. Densitometric analysis of immunoblots demonstrating effect of miR-451-a inhibitor/inhibitor-control/miR-451a mimic/mimic-control transfection in JEV-infected (48 h) Neuro-2A (A, bottom: ratio of cleaved-caspase-3 to total-caspase-3), JEV-infected SH-SY5Y (B, bottom: ratio of cleaved-caspase-3 to total-caspase-3) and WNV-infected Neuro-2A cells (C, bottom: ratio of cleaved-caspase-3 to total-caspase-3) upon cleaved-caspase-3 normalized to total-capase-3. JEV/WNV-infected Neuro-2A (D) and SH-SY5Y (E) cells transfected with miR-451a inhibitor/Inhibitor-Ct prior to infection were collected after indicated time period and stained using annexin-FITC and propidium iodide followed by analysis using BDFacs Verse for detection of proportion of apoptotic cells along with their quantitative estimation as bar graphs representing proportion of apoptotic cells (D, right and E, right). Bar graphs in the form of mean ± SD represent data from three independent experiments. *, P < 0.05, **, P < 0.01, by two-tailed Student’s t test.

