FIG 5.
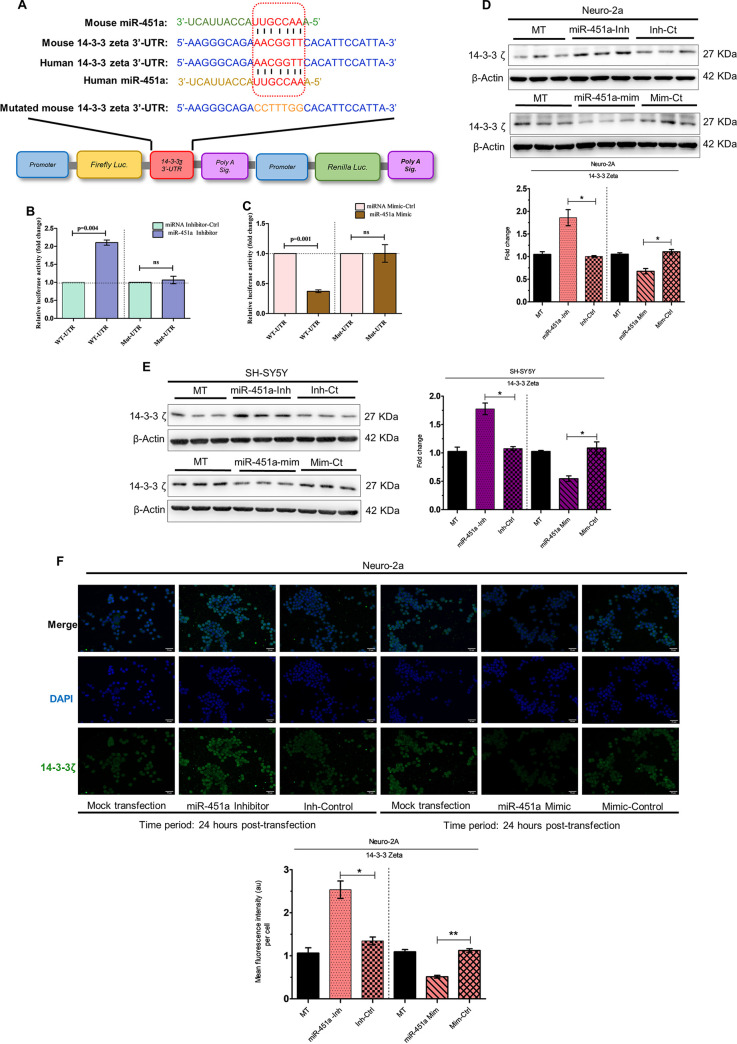
14-3-3ζ acts as a potential target for miR-451a in neuronal cells. Mouse and human miR-451a sequence and their respective binding sites at 3′-UTR of 14-3-3ζ (WT-UTR) are demonstrated (A). The miR-451a binding site in 14-3-3ζ 3′-UTR is marked in red. The mouse mutant 3′-UTR (Mut-UTR), which possesses mutations in the miR-451a binding-site is marked in orange. Dual luciferase assay employing transfection of Neuro-2A cells by WT-UTR or Mut-UTR along with miR-451a inhibitor/inhibitor-control (B) or miR-451a mimic/mimic-control (C) was performed, and data are presented as relative luciferase activity (RLA). Bar graphs demonstrating RLA in the form of mean ± SD were generated using data from 3 independent transfection experiments. Firefly luciferase activity was normalized using renilla luciferase activity expressed by the same reporter plasmid. Statistical significance of differences in RLA were estimated using Student's t test. Proteins isolated from mock-transfected (MT), miR-451a inhibitor, inhibitor-control-, miR-451a mimic-, and mimic-control-transfected Neuro-2A (D) or SH-SY5Y (E) cells for 24 h were subjected to immunoblotting experiments for analyzing 14-3-3ζ abundance. Blots are representative of experimental triplicate with similar outcome. ß-actin served as a loading control. Densitometric analysis of 14-3-3ζ abundance (normalized to ß-actin) in Neuro-2A (D, bottom: ratio of 14-3-3ζ to ß-actin) and SH-SY5Y cells (E, right: ratio of 14-3-3ζ to ß-actin) upon transfection with miR-451a-inhibitor/inhibitor-control or miR-451a mimic/mimic-control. ß-actin was used as a loading control. Immunocytochemical analysis of 14-3-3ζ expression following mock-, miR-451a inhibitor-, inhibitor-control-, miR-451a mimic-, and mimic-control-transfected Neuro-2A cells (F) for 24 h. Scale bar denoted in each micrograph measures 50 μm; original (×20 magnification). Quantitative analysis of effects of miR-451a-inhibitor/inhibitor-control or miR-451a mimic/mimic-control upon relative abundance of 14-3-3ζ in Neuro-2A cells (F, bottom). Data presented in bar graphs in the form of mean ± SD denote data collected from three independent experiments with similar outcomes. *, P < 0.05; **, P < 0.01; ns=non-significant, by two-tailed Student's t test.

