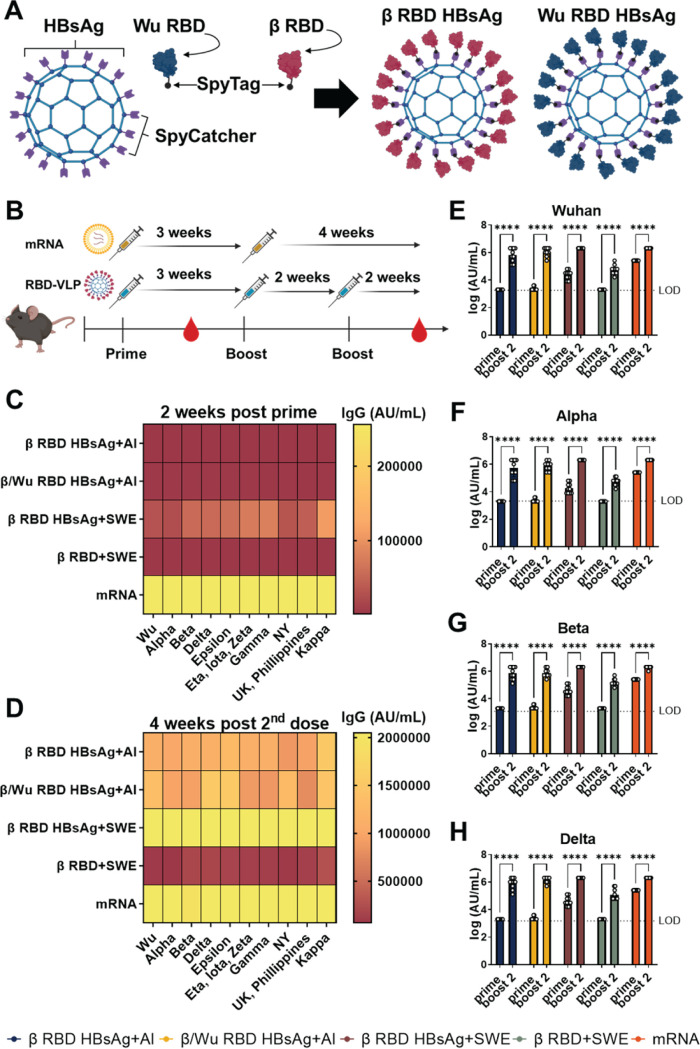
FIG 1.
Characterization of RBD IgG antibody responses against 10 SARS-CoV-2 VOC RBDs. (A) Depiction of assembly of β or Wuhan RBD on HBsAg using SpyTag and SpyCatcher technology. (B) Schematic of K18-hACE2 mouse immunization and serological assessment schedule. (C) MSD V-PLEX SARS-CoV-2 IgG panel 11 was used to determine RBD IgG levels. The heat map depicts mean values of IgG (AU/mL) generated from each mouse. RBD IgG titers were measured against 10 VOC RBDs at 2 weeks post prime. (D) Four weeks post-second dose RBD IgG titers against 10 VOC RBDs. (E to H) RBD IgG titers from 2 weeks post prime and 4 weeks post-second dose against Wuhan, Alpha, Beta, and Delta RBD VOC, respectively. IgG titers are represented as log AU/mL. Two-way ANOVA with Sidak’s multiple-comparison test was performed for statistical analysis. ****, P < 0.0001, The dotted line represents the limit of detection for the specific RBD variant.

