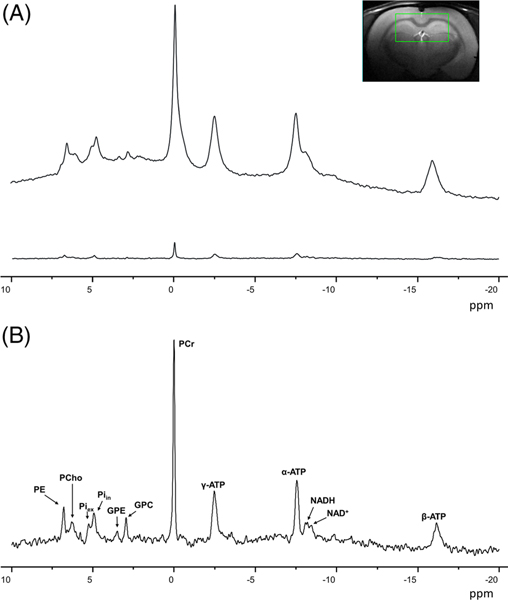
FIGURE 4.
A, Effect of localization on 31P spectra in the rat brain at 9.4 T. The upper spectrum was acquired in a pulse-acquire experiment (no localization), while the lower spectrum was acquired using an ISIS localization sequence (voxel size 5 × 9 × 9 mm3). Spectra were acquired with TR = 8 s and 512 averages in both cases. A strong signal reduction and baseline flattening are observed. B, Magnification of localized spectrum, with the corresponding metabolites

