
Fig. 2. Difference in prevalence of baseline characteristics (original−reproduction).
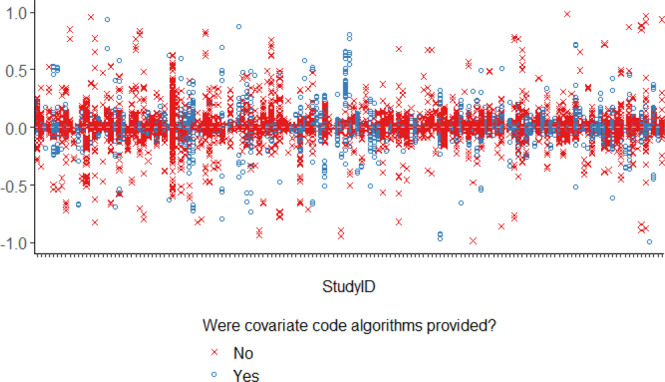
Each column represents covariates from a different study. Each point represents the difference in corresponding cell values from tables describing characteristics of the cohort in the original paper and the reproduction. Dashed horizontal gray line at 0.0 reflects no difference in prevalence of baseline characteristic between original and reproduction cohorts. Source data are provided as a Source Data file.