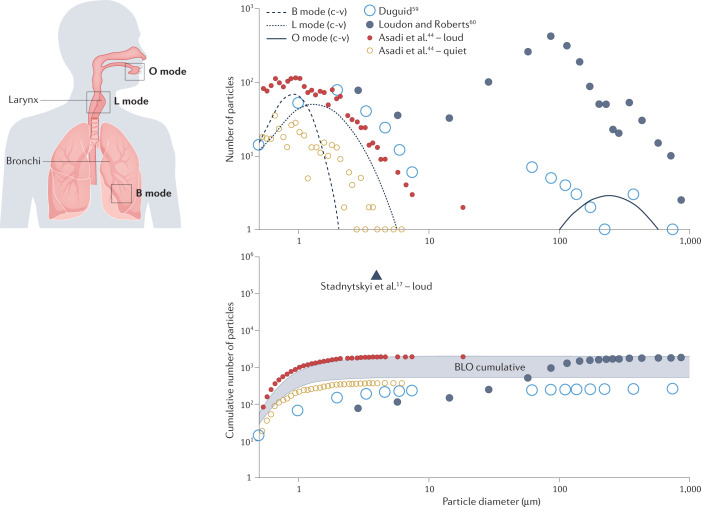
Fig. 2. A trimodal distribution of particles emitted by speaking subjects, and their cumulative emissions.
BLO data (where B represents particles from bronchioles, L larynx and O mouth) are from ref.5. Other data are from refs.44,59,60. The BLO cumulative shaded range spans the c-v to aah-v particle totals from all three modes for uncorrected data (where c-v represents speech and aah-v represents sustained vocalization; see text for details).

