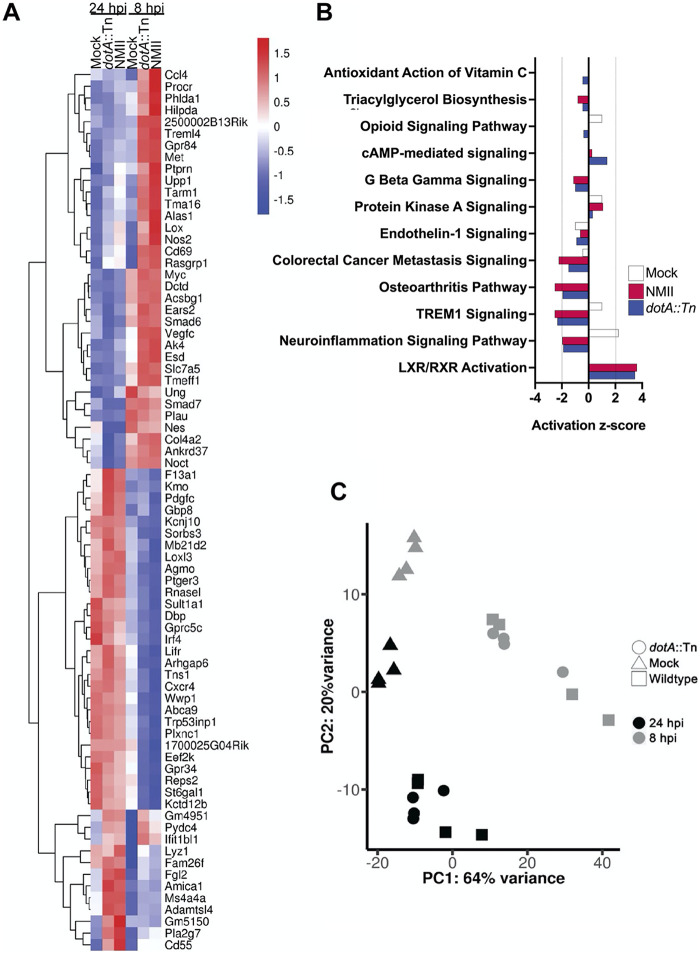
FIG 2.
BMDM transcriptional response to C. burnetii at 8 and 24 h postinfection. (A) Heat map displaying the most highly differentially expressed BMDM genes at 8 and 24 h postinfection (hpi). The legend shows the range of log2-transformed fold changes of genes either upregulated (red) or downregulated (blue) in response to infection with either wild-type C. burnetii (NMII) or a T4SS-null mutant (dotA::Tn). (B) Canonical pathways predicted by Ingenuity Pathway Analysis (IPA) to be differentially regulated in response to infection with wild-type or T4SS-null C. burnetii. (C) Principal-component analysis of the RNA-seq data set. RNA from four independent experiments was sequenced using mock-infected BMDM (triangles) or BMDM infected with either wild-type C. burnetii (NMII, squares) or T4SS-null C. burnetii (dotA::Tn, circles) at 8 hpi (gray) and 24 hpi (black).

