FIG 2.
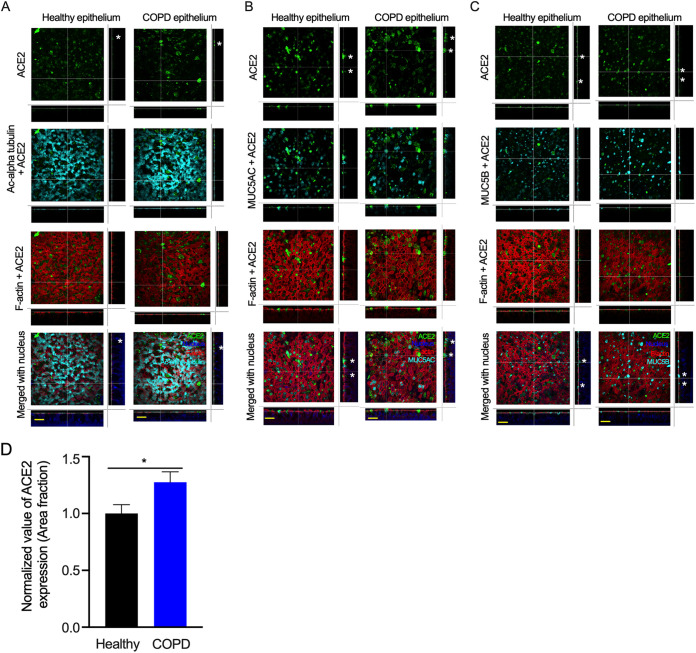
ACE2 is expressed at higher levels in goblet cells. The airway epithelia were generated and fixed as described in Fig. 1 (A) Cells were stained for ACE2 (anti-ACE2, green), cilia (anti-acetyl-alpha tubulin, cyan) F-actin (rhodamine phalloidin, red), and nuclei (DAPI, blue). Bar = 30 μm. (B) Cells were stained for ACE2 (anti-ACE2, green), MUC5AC+ goblet cells (anti-MUC5AC, cyan), F-actin (rhodamine phalloidin, red), and nuclei (DAPI, blue). Bar = 30 μm. (C) Cells were stained for ACE2 (anti-ACE2, green), MUC5B+ goblet cells (anti-MUC5B, cyan), F-actin (rhodamine phalloidin, red), and nuclei (DAPI, blue). Bar =30 μm. The asterisks (*) indicate ACE2 on the epithelial surface. (D) The ACE2-stained area fraction of healthy and COPD samples was measured using ImageJ software. The error bars represent the SEMs. The statistical significance was determined by unpaired two-tailed t tests. The results from three independent experiments are shown.

