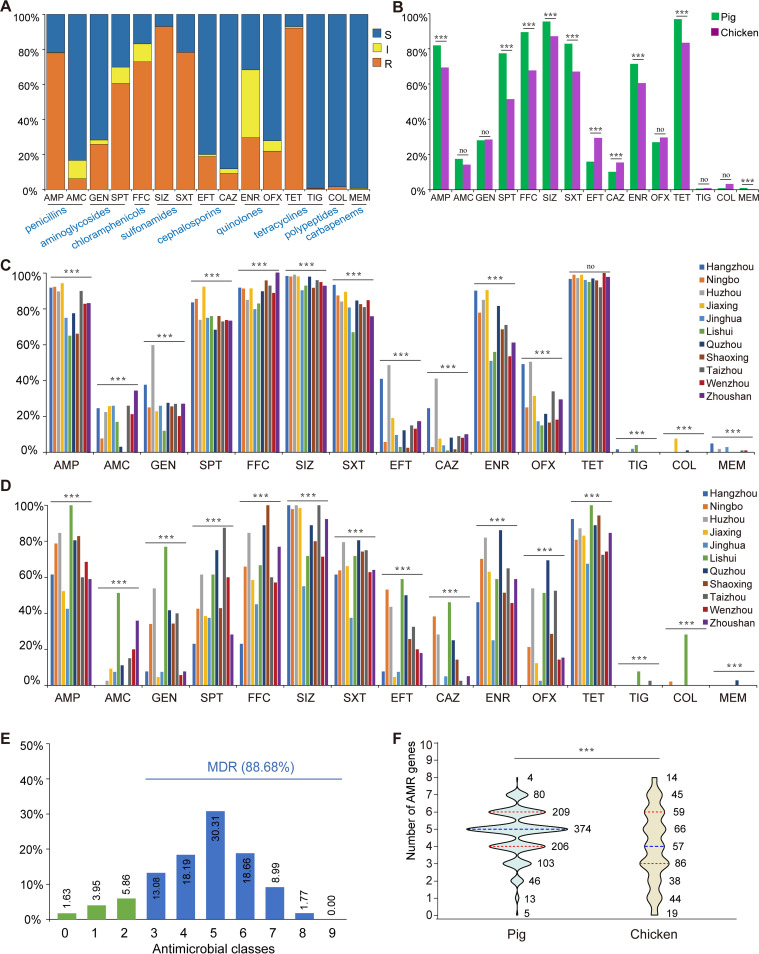
FIG 2.
The antimicrobial-resistance phenotypes of the 1,468 E. coli from pigs and chickens in Zhejiang Province. (A) The column chart of antibiotic resistance rates of E. coli isolates. The blue and orange shading represents resistant (R) and intermediate (I) rates that were incorporated into nonsusceptible (NS). The gray shading represents the susceptible (S) rate. (B) The difference in resistance rates for the isolates from pigs and chickens among 15 antimicrobials. ***, P < 0.001; no, no significant difference between the two groups (P > 0.05). (C) The resistance rates of isolates from pigs in 11 cities. (D) The resistance rates of isolates from chickens in different cities. The blue, orange, gray, yellow, light blue, green, dark blue, brown, dark gray, red, and purple represent Hangzhou, Ningbo, Huzhou, Jiaxing, Jinghua, Lishui, Quzhou, Shaoxing, Taizhou, Wenzhou, and Zhoushan, respectively. (E) Prevalence of multidrug resistance among 1,468 E. coli isolates. The isolates’ resistance to three or more different types of antimicrobials was classified as MDR, and the rate is shown in blue. The non-MDRs are shown in green. (F) Differences in the MDR rate between the strains from pigs and chickens. The blue dotted line represents the median, and the red dotted lines represent the quartiles.

