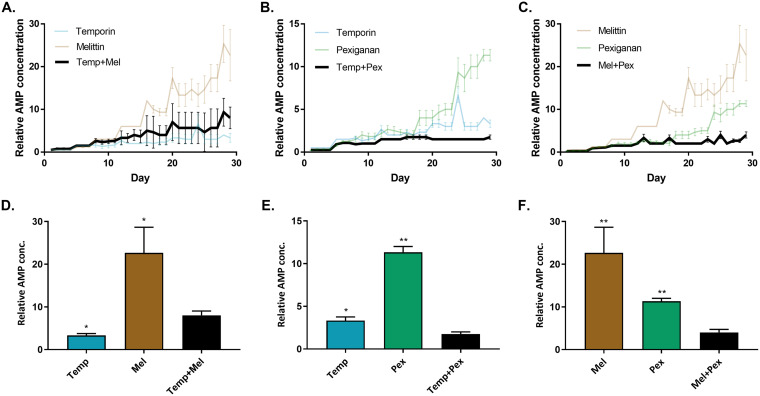
FIG 2.
AMP combinations can hinder the evolution of resistance. Data represents the concentration of AMPs where bacteria grew, normalized to initial MIC (n = 6; mean ± standard error [SE]; growth defined as OD595 > 0.3). (A) Temporin-melittin combination. (B) Temporin-pexiganan combination. (C) Melittin-pexiganan combination. Each graph shows the concentrations of individual AMPs and their combinations through the evolution. (D to F) Comparison of the relative AMP concentration after 29 transfers. Each bar represents the mean of six lines + standard error of the mean (SEM). *, P < 0.05; **, P < 0.01 (Mann-Whitney U test with Bonferroni correction; results compared to combinations strains). Data of individual AMPs is identical in all panels. Mel, melittin; Pex, pexiganan; Temp, temporin. For additional statistics information, see Table S4 in the supplemental material.

