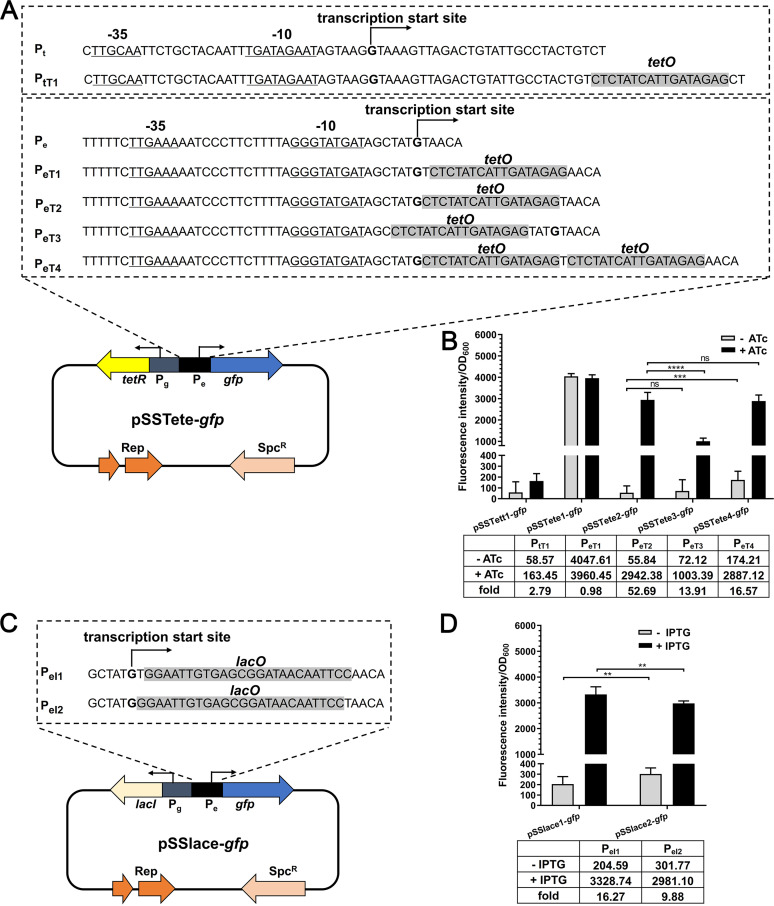
FIG 2.
Construction and evaluation of the ATc- and IPTG-inducible expression systems. (A) Characterization of ATc-inducible promoters. The putative −10 and −35 regions and the transcription start site of the promoters were analyzed by using Softberry BPROM software. The expression of tetR was driven by Pg, and that of gfp was driven by Pe. The operator sequence was inserted into different positions of Pe. (B) Detection of the expression of the ATc-inducible expression systems. S. suis cells harboring the indicated plasmid were grown to the mid-log phase and induced with or without 200 ng/mL ATc for 60 min at 37°C. The cells were harvested and washed with PBS, and the fluorescence intensity was measured using a spectrometer. − ATc, average expression level in the absence of inducer; + ATc, average expression level in the presence of inducer; fold, fold change with ATc, compared with the value without ATc. Statistical analysis was performed using the unpaired Student's t test to compare the activity of promoters PeT2, PeT3, and PeT4 with or without 200 ng/mL ATc. **, P < 0. 01; ***, P < 0.001; ****, P < 0.0001; ns, not significant. The data are presented as the mean ± standard deviation. (C) Characterization of IPTG-inducible promoters. The expression of lacI was driven by Pg, and that of gfp was driven by Pe. The operator sequence was inserted into different positions of Pe. (D) Detection of the expression of the IPTG- inducible expression systems. S. suis cells harboring the indicated plasmid were grown to the mid-log phase and induced with or without 0.2 mM IPTG for 60 min at 37°C. – IPTG, average expression level in the absence of inducer; + ITPG, average expression level in the presence of inducer; fold, fold change with IPTG, compared with the value without IPTG. Statistical analysis was performed using the unpaired Student's t test to compare the activity of promoters PeI1 and PeI2 with or without 0.2 mM IPTG.

