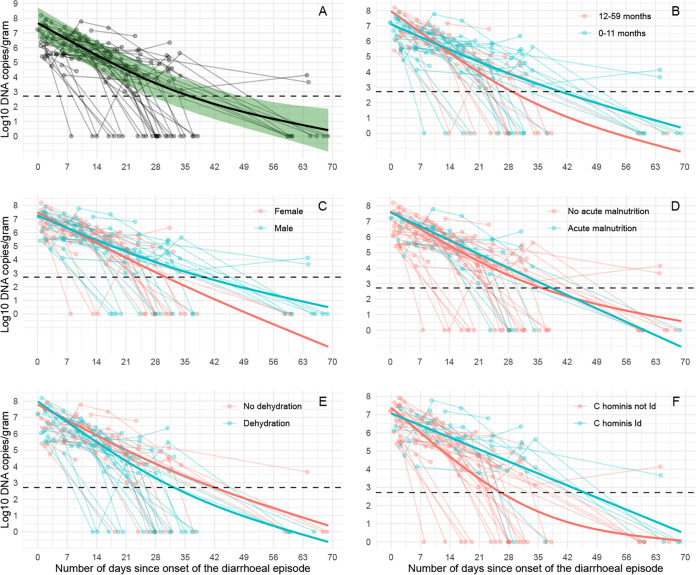
FIG 3.
Temporal patterns of Cryptosporidium shedding. Cryptosporidium DNA quantity in log10 DNA copies/g; (A) overall, and stratified by (B) age, (C) sex, (D) acute malnutrition, (E) dehydration, and, (F) for C. hominis infections, gp60 allele family. The dashed horizontal line represents the lowest reliable detection limit of the qPCR assay (519 copies/g). The shaded green area (A) represents the 95% confidence interval for the smoothed quantity estimate.

