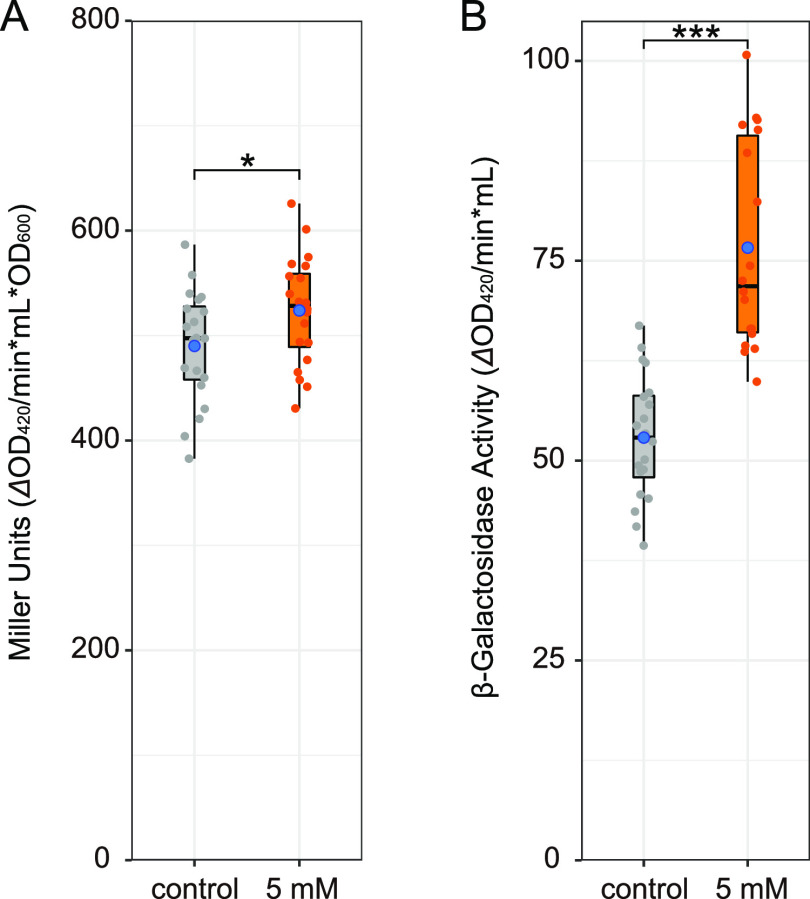
FIG 2.
β-Galactosidase activity in E. coli cultures treated with and without diaphorin. Jitter plots of all data points (n = 20) and box plots (gray, control; orange, 5 mM diaphorin) showing their distributions (median, quartiles, minimum, and maximum) are presented. Blue dots represent the means. (A) β-Galactosidase activity in the form of Miller unit, 1,000 × [(OD420 − 1.75 × OD550)/(t × v × OD600)], where t is time of the enzymatic reaction (minutes) and v is volume of culture used in the assay (milliliters), showing the activity relative to the cell biomass. The asterisk indicates the statistically significant difference (*, P < 0.05; Welch’s t test). (B) β-Galactosidase activity without calibration with OD600, 1,000 × [(OD420 − 1.75 × OD550)/(t × v)], showing the activity relative to the culture volume. Asterisks indicate the statistically significant difference (***, P < 0.001; Welch’s t test).

