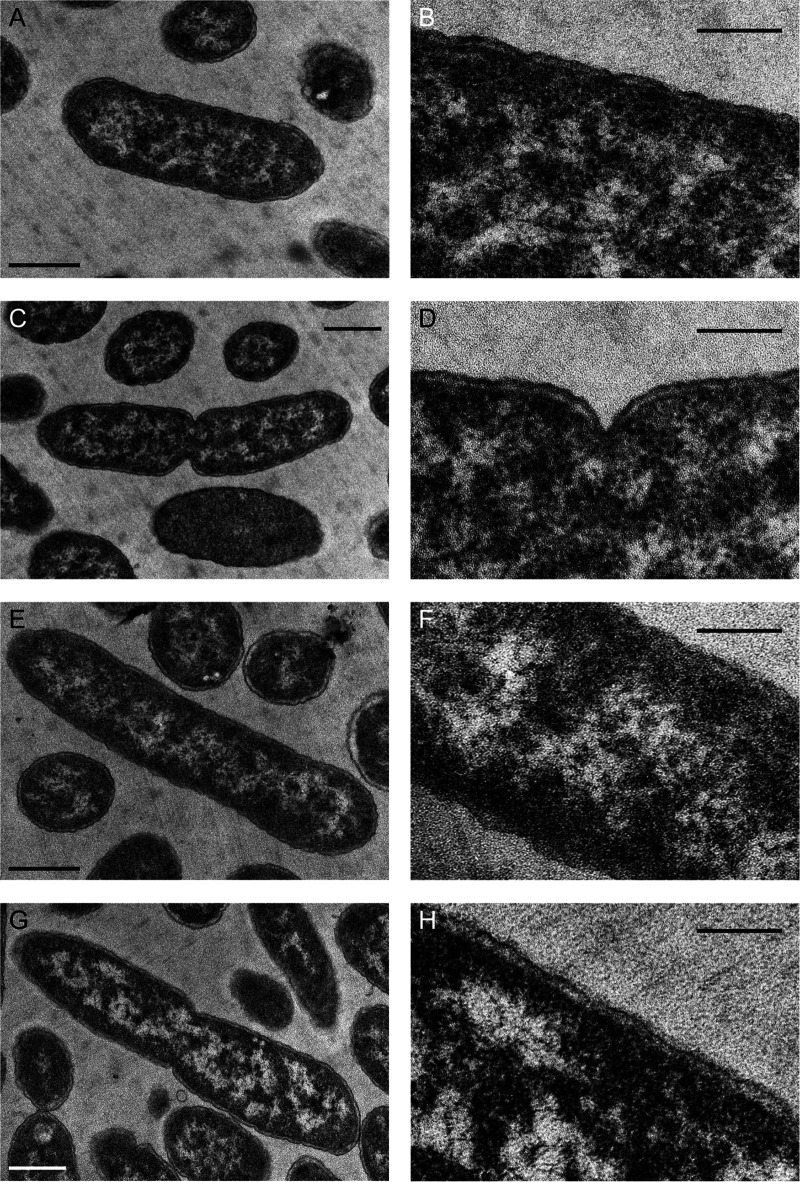
FIG 3.
TEM of E. coli cultured for 7 h in a medium containing 0 mM (A to D) or 5 mM (E to H) diaphorin. Panels B, D, F, and H (bars, 200 nm) are magnified images of panels A, C, E, and G (bars, 500 nm), respectively. No conspicuous difference was observed in the ultrastructures between control and diaphorin-treated E. coli.

