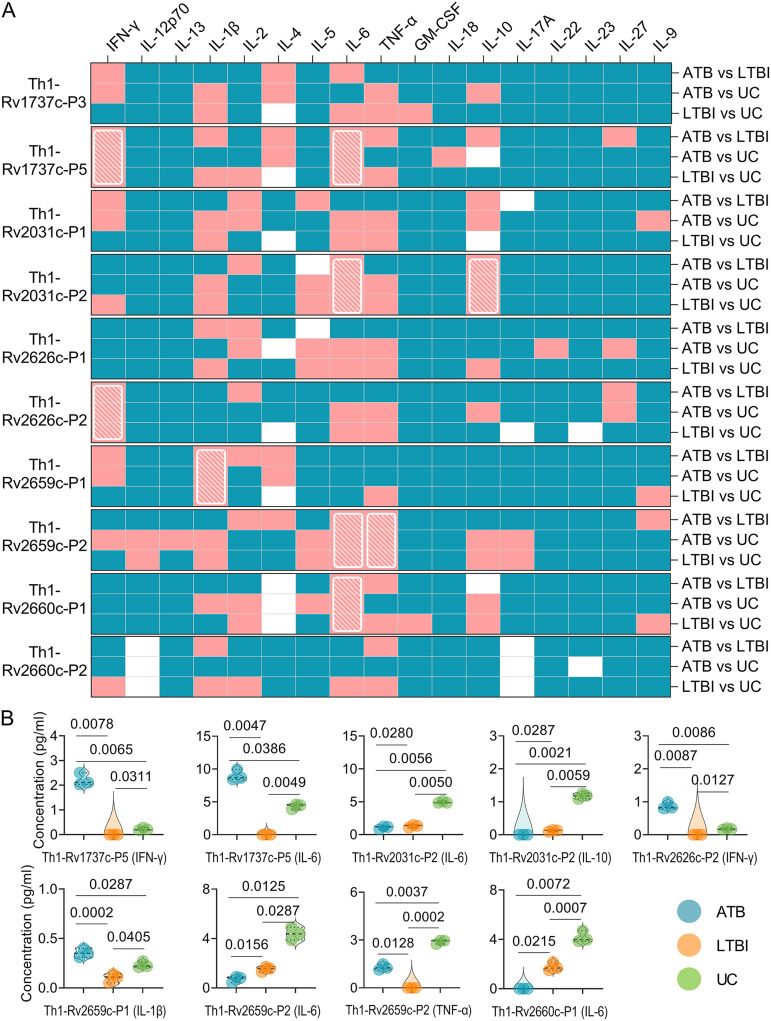
FIG 5.
Cytokines induced by Th1 dominant peptides in mice. The splenocytes collected from mice in ATB, LTBI, and UC groups were stimulated with 10 Th1 dominant peptides for 48 h. The levels of IFN-γ, IL-12p70, IL-13, IL-1β, IL-2, IL-4, IL-5, IL-6, TNF-α, GM-CSF, IL-18, IL-10, L-17A, IL-22, IL-23, IL-27, and IL-9 cytokines in the supernatant were detected with a mouse Th1/Th2/Th9/Th17/Th22/Treg cytokine kit. The cytokine concentration differences among the three groups were compared using two-way ANOVA corrected with the Tukey test. All data were shown as means ± the SEM (n = 3). (A) P value differences in the cytokine concentrations between groups (ATB versus LTBI, ATB versus UC, and LTBI versus UC) are shown as a heat map. P < 0.05 was considered significantly different and is shown as a pink box, and P ≥ 0.05 is shown as a blue box in the heat map. Furthermore, P values of <0.05 for cytokines induced by a peptide between the ATB versus LTBI, ATB versus UC, and LTBI versus UC groups are presented as a white diagonal grid in a heat map. (B) Detailed information is shown in violin plots.

