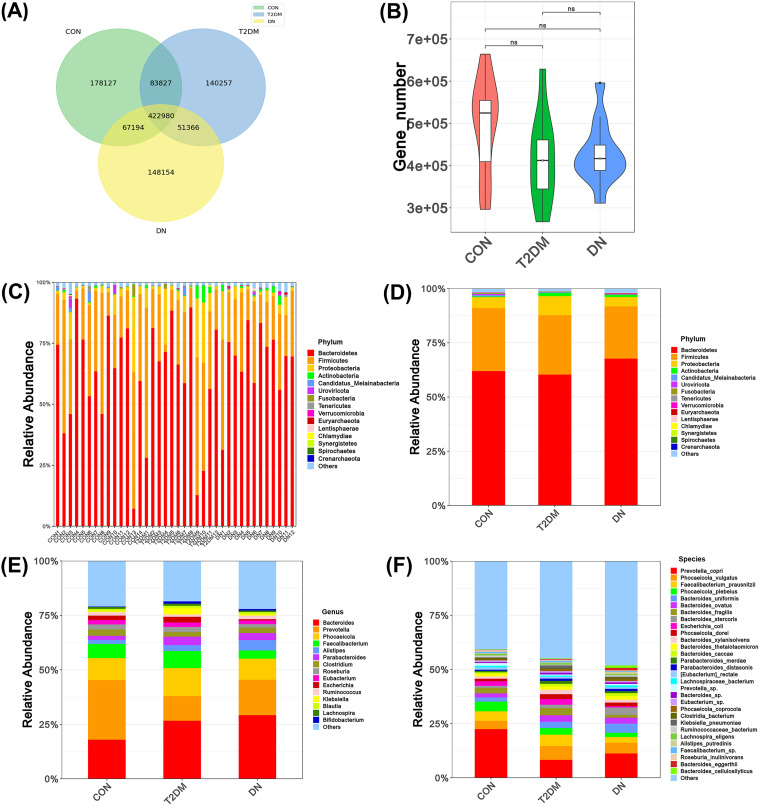
FIG 1.
Gut microbiota compositions of the CON, T2DM, and DN groups. (A) Venn diagram of gene numbers in the CON, T2DM, and DN groups. (B) Wilcoxon rank sum test of gene numbers in CON, T2DM, and DN patients. (C) Gut microbiota composition at the phylum level of each sample. (D) Gut microbiota composition at the phylum level. (E) Gut microbiota composition at the genus level. (F) Gut microbiota composition at the species level.

