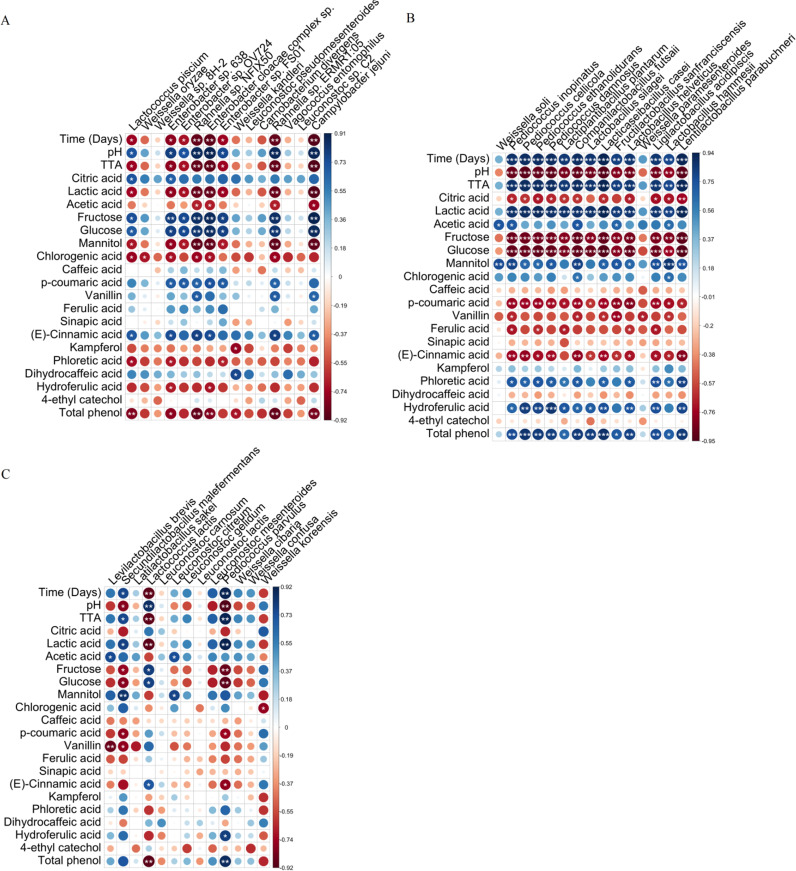
FIG 5.
Graphical representation of correlations between sauerkraut microbiome and time of fermentation (days), physicochemical and biochemical composition, and phenolic compounds profile. Spearman's rank correlation matrix between the top 15 bacterial species identified during the first week of fermentation (A), the top 15 species dominant identified between 2 weeks and the end of fermentation (B), overall sauerkraut microbiome throughout the fermentation having a minimum presence threshold of 85% (C). To assess the association between continuous and dichotomous variables, a point-biserial correlation was used. Large and small circles indicate strong and weak correlations, respectively. Colors of the scale bar describe the type of correlation: 1 indicates a perfect positive correlation (dark blue) and −1 indicates a perfect negative correlation (dark red) between two microbial populations. The significance P values corrected by FDR are represented by *, < 0.05; **, < 0.01; ***, < 0.001.

