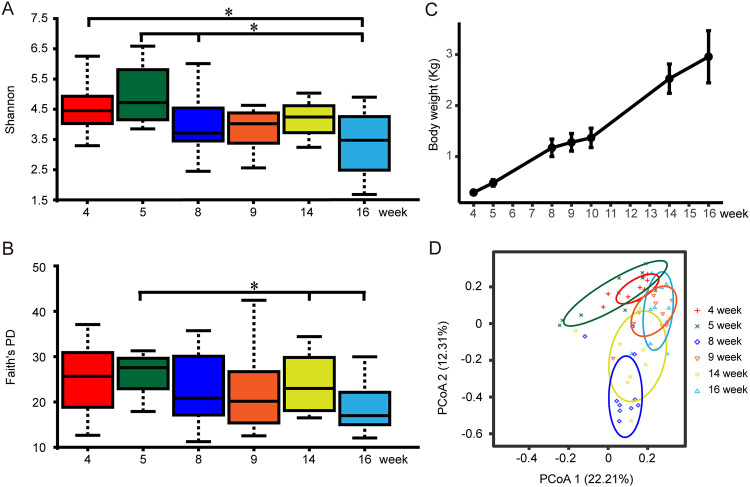
FIG 1.
Changes in microbial diversity and body weight of experimental broilers. (A) The Shannon index at six time points. The box plot shows the quartile, median, and extreme limit of the value. The Kruskal-Wallis H test was used to test the significance of differences. (B) Faith’s PD index at six time points. The box plot shows the quartile, median, and extreme limit of the value. The Kruskal-Wallis H test was used to test the significance of differences. (C) The body weight of experimental broilers at seven time points. (D) Principal-coordinate analysis (PCoA) based on weighted Bray-Curtis distance. PERMANOVA was used to detect the significance of separation between groups.

