FIG 2.
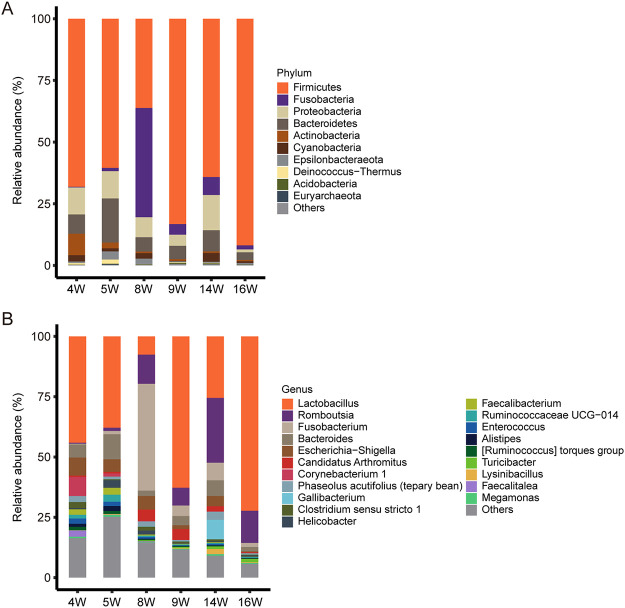
The microbial composition at the phylum level and genus level. Each bar represents the average relative abundance of each taxon within a time point. (A) The top 10 microbes in relative abundance in feces at the phylum level; the phyla with lower relative abundance are classified as “Others.” (B) The top 20 microbes in relative abundance in feces at the genus level; the genera with lower relative abundance are classified as “Others.”

