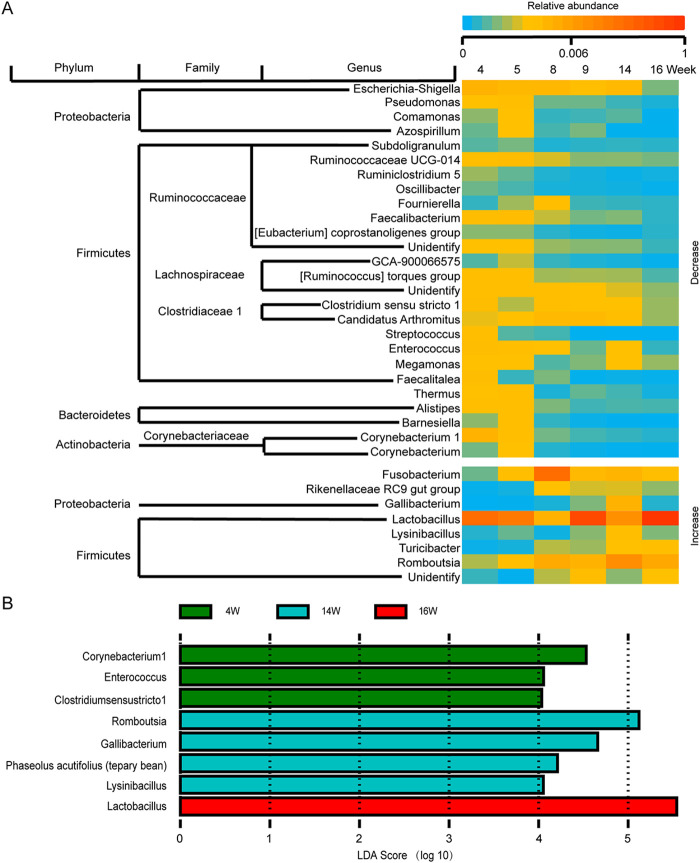
FIG 3.
Changes of flora abundance and microbial biomarkers at different time points. (A) The genera whose average relative abundance within each time point was significantly correlated with different sampling time points (4, 5, 8, 9, 14, and 16 weeks) (Pearson, P < 0.05 and FDR < 0.25). (B) Eight microbial biomarkers from three groups (LDA > 4 and P < 0.05). Different colors depict different time groups.

