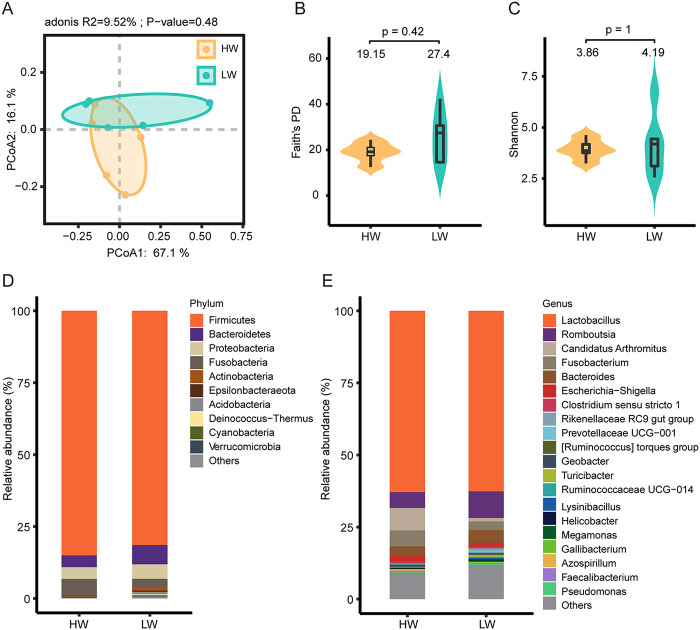
FIG 4.
Microbial diversity and composition in HW and LW. (A) Principal-coordinate analysis (PCoA) based on weighted Bray-Curtis distances. PERMANOVA was used to detect the significance of separation between groups. (B and C) Faith’s PD and Shannon index in HW and LW. The box plot shows the quartile, median, and extreme limit of the value. The violin plot shows the distribution of values. The numbers above the violin plots represent the median values. The Mann-Whitney test was used to test the significance of differences. (D) The top 10 microbes with the highest relative abundances in HW and LW at the phylum level; the phyla with lower relative abundance are classified as “Others.” (E) The top 20 microbes with the highest relative abundances in HW and LW at the genus level; the genera with lower relative abundance are classified as “Others.”

