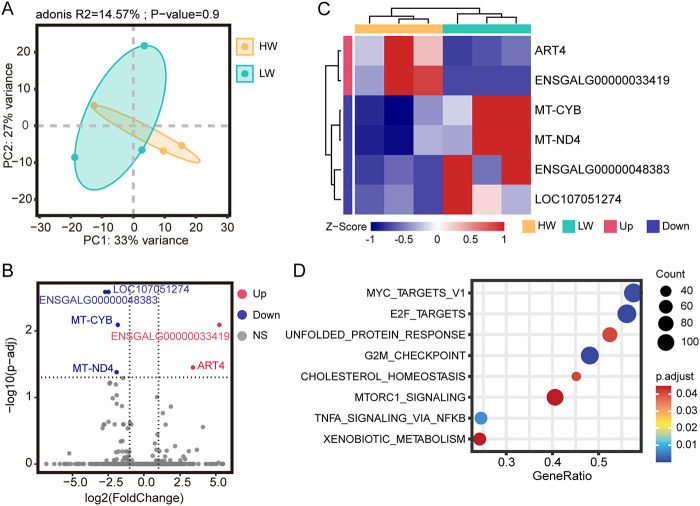
FIG 7.
Transcriptomic analysis of differentially expressed genes in cecum between HW and LW. (A) Principal-component analysis (PCA) based on gene expression as transcripts per million (TPM). The dashed range represents the smallest ellipse surrounding all samples in each group. PERMANOVA was used to detect the significance of separation between groups. (B) Volcano plot of differentially expressed genes between the two groups. (C) Z-score heatmap of differentially expressed genes (Z-score by row). Each column represents a sample, and each row represents a gene. (D) Bubble plot of GSEA enrichment results (FDR, Padj < 0.05).

