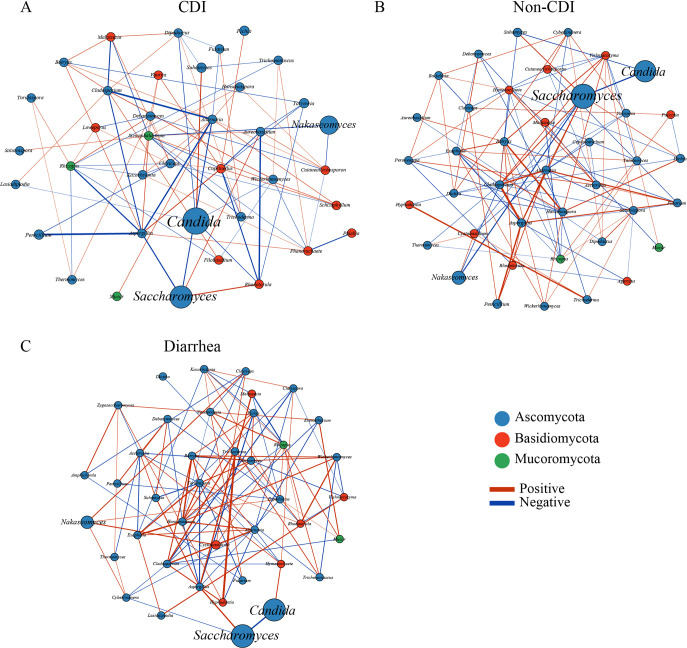
FIG 5.
Fungal correlation networks from C. difficile infection (CDI) (A), non-CDI (B), and diarrhea (C). Network analysis showed interactions of 40 richest genera. The genera are represented as nodes, and abundance is represented by node size. Node color corresponds to phylum taxonomic classification. Edges between nodes represent fungal correlations between the nodes, with edge color indicating positive (green) and negative (red) correlations, respectively. The absolute value of the correlation coefficient is represented by the edge thickness, and only absolute correlation coefficients > 0.1 with P < 0.05 are presented.

