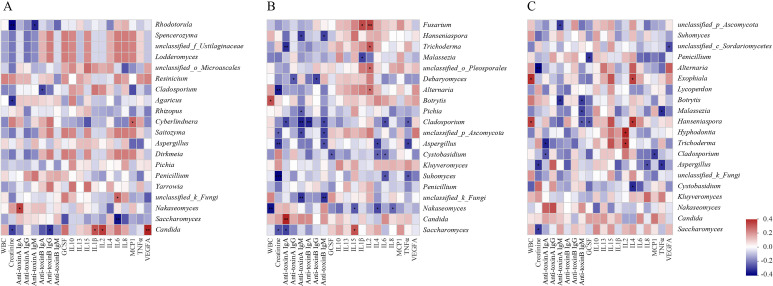
FIG 6.
Spearman correlations between fungal communities and serum immune factors from C. difficile infection (CDI) (A), non-CDI (B), and diarrhea (C). The rows display the fungal taxa at the genus level and, the columns represent the immune factors. Red, positive correlations; blue, negative correlations. The intensity of the color represents the degree of association between fungal communities and serum immune factors. *, P < 0.05; **, P < 0.01; ***, P < 0.001. WBC, white blood cell; GCSF, granulocyte colony-stimulating factor; IL, interleukin; MCP, monocyte chemoattractant protein; TNF, tumor necrosis factor; VEGF, vascular endothelial growth factor.

