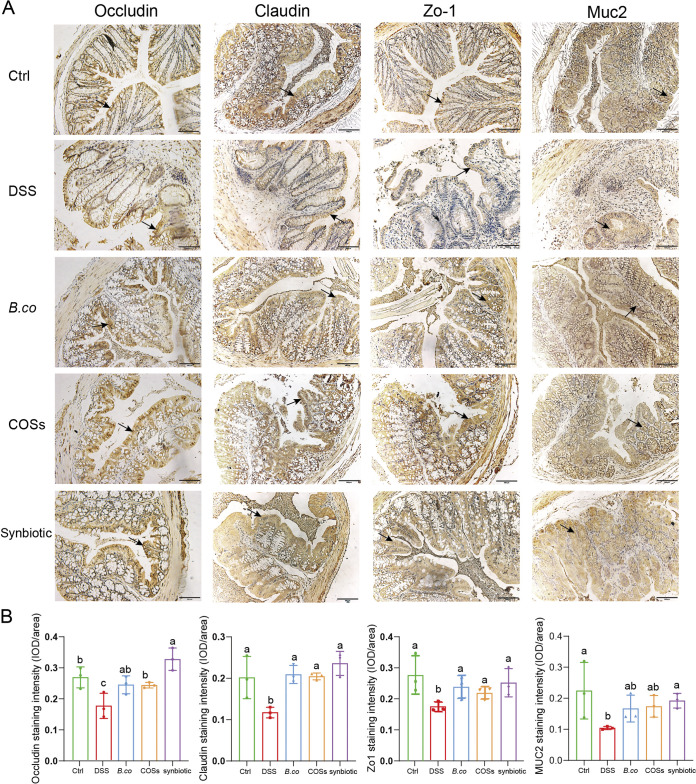
FIG 6.
Effect of B. coagulans, COSs, and synbiotic on the expression of tight junction proteins. (A) Microscopic images of proximal colonic tissues stained with immunohistochemical of Occludin, Claudin, Zo-1, Muc2. Scale bars represent 100 μm. Arrows indicate the IHC positivity. (B) Mean optical densities with Image-pro plus soft of respective group is illustrated in the graph. Data are shown as means ± SEM. Data with different superscript letters are significantly different (P < 0.05) according to one-way ANOVA followed by Tukey’s test. Ctrl: healthy control; DSS: DSS-treated group; B. co, COSs, and Synbiotic: supplementation of B. coagulans spores, COSs, or spores + COSs, respectively.

