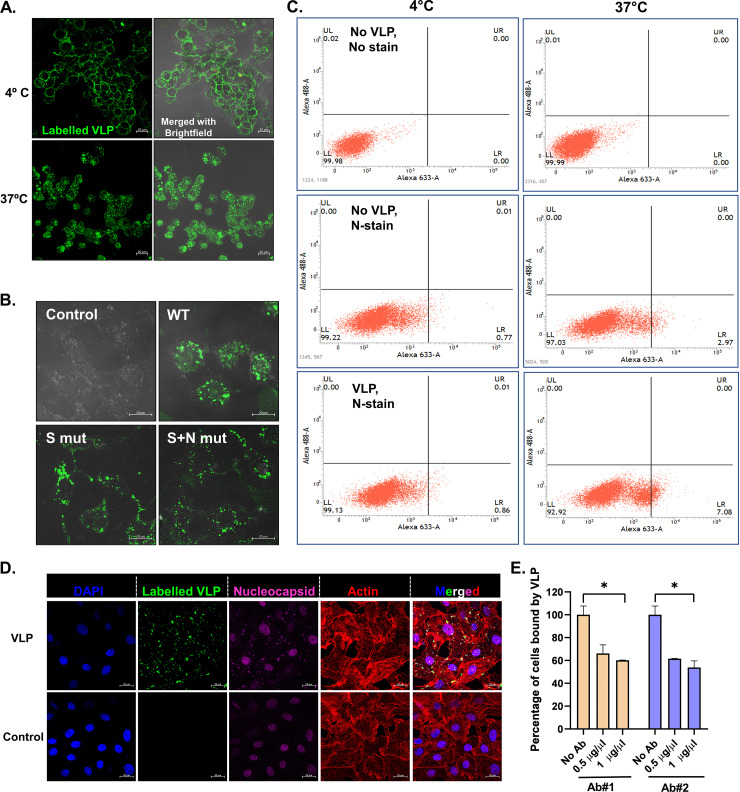
FIG 3.
VLP binding and entry into cells. (A) Dynamics of VLP binding to cells. AF488-labeled VLPs were incubated with Vero cells at the indicated temperature, and VLP binding was visualized by confocal imaging. Bar, 20 μm. (B) Vero cells were incubated with AF488-labeled VLPs for 2 h and processed for confocal imaging. Bar, 20 μm. (C) Unlabeled VLPs were incubated with Vero cells at the indicated temperatures for 2 h, followed by immunostaining using nucleocapsid (N) protein-specific primary antibody and AF633-labeled secondary antibody. The percentage of cells bound by N antibody was quantified by flow cytometry. (D) AF488-labeled VLPs were incubated with Vero cells at 37°C for 2 h, followed by immunostaining using nucleocapsid (N) protein-specific primary antibody and AF633-labeled secondary antibody. Nucleus was counterstained with DAPI, and the cell boundary was visualized with rhodamine-phalloidin. Bar, 20 μm. (E) Labeled VLPs were incubated with the indicated concentration of commercial antibodies against S protein prior to binding with Vero cells. VLP binding to cells after preincubation was analyzed by flow cytometry and quantified. Blue and pink colors represent the two different antibodies used. Student’s t test was used for statistical analysis. Error bars represent standard errors of the means. *, P < 0.05; **, P < 0.01; ***, P < 0.001.

