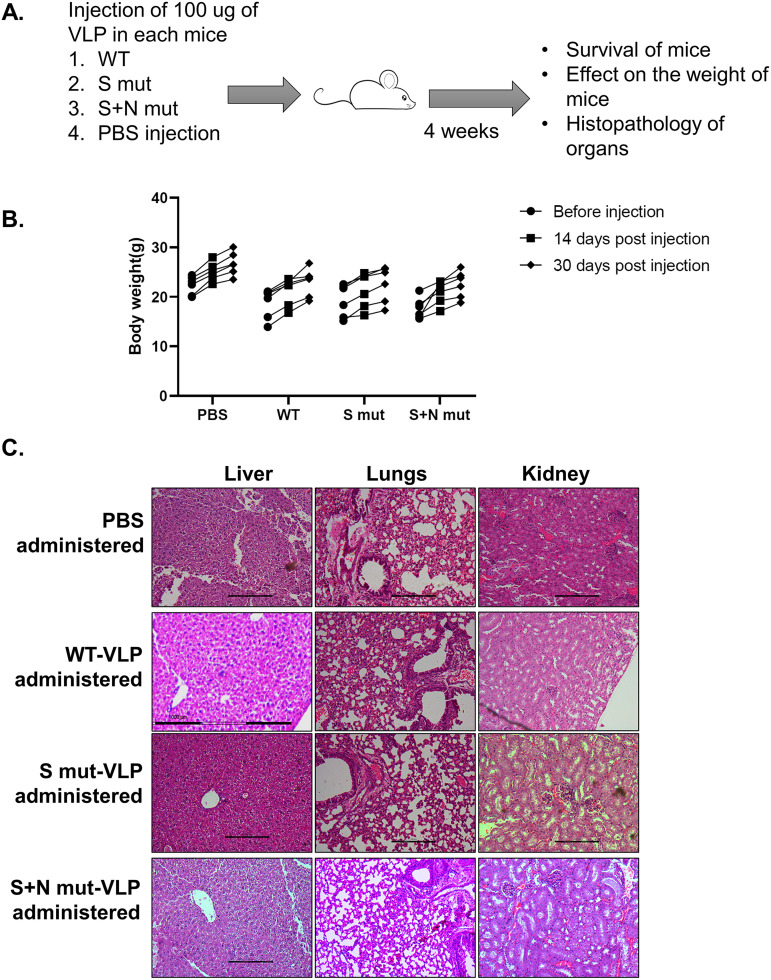
FIG 4.
VLP toxicity analysis in mice. (A) Workflow for VLP toxicity analysis in mice. (B) Body weight of mice was recorded at the mentioned time points after VLP administration. Six animals were included for each group. Each dot represents a different animal. (C) Light microscopy images of liver, lungs, and kidney sections of PBS-treated or respective VLP-treated mice after hematoxylin and eosin staining of the sections. The images are representative of one animal from each group.

