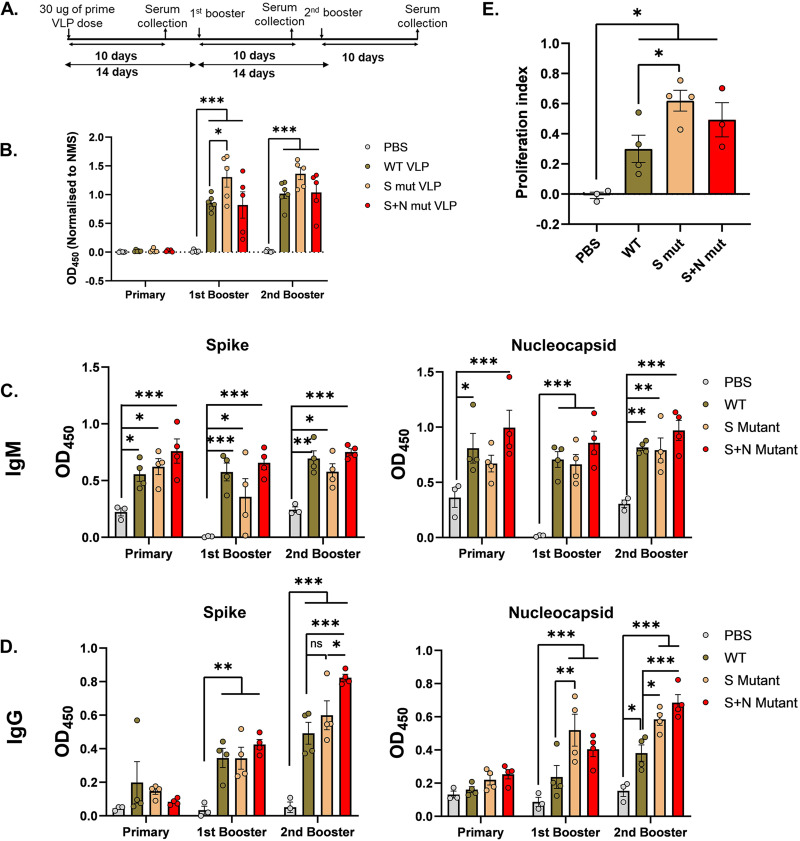
FIG 5.
Immune response against SARS-CoV-2 VLP injection in mice. (A) Schematic of immunogenicity studies in mice. ELISA was performed with murine sera collected after immunization with the indicated VLPs at different time points. (B to D) WT-VLP or full-length spike protein or nucleocapsid protein were used as antigens. Mouse serum samples were added to the coated antigens and either HRP-tagged IgG and IgM (B) or biotin-labeled IgM and IgG antibodies (C and D) were used as secondary antibodies. Color development by streptavidin-HRP followed by addition of TMB substrate was quantified and plotted after normalization as described previously. Sera from 3 animals for PBS injection and 4 animals each for the VLP injection were analyzed by ELISA. Each point represents the value obtained from individual mouse serum. Two-way ANOVA was done for statistical analysis. Error bars represent SEM. *, P < 0.05; **, P < 0.01; ***, P < 0.001. (E) Splenocyte proliferation in response to peptides against spike protein was quantified in an MTT assay. MTT was added after 24 h of peptide stimulation, and color development was quantified and plotted. Each point represents splenocyte proliferation from a different mouse. Student’s t test was used for statistical analysis. Error bars represent SEM. *, P < 0.05; **, P < 0.01; ***, P < 0.001.

