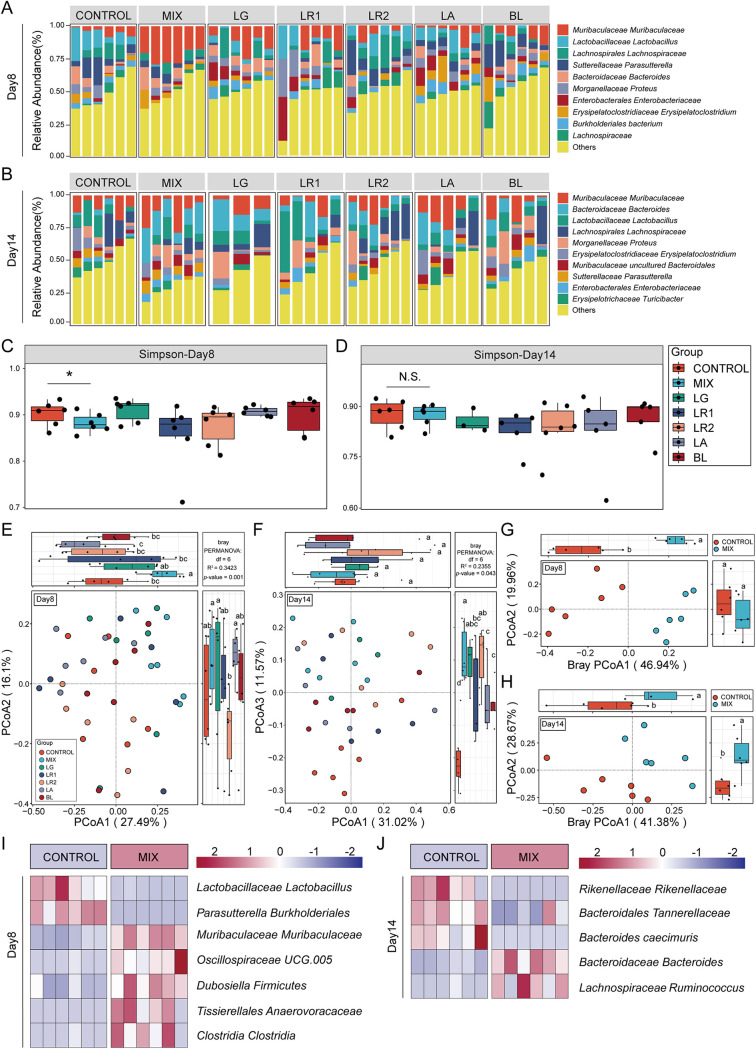
FIG 3.
Probiotic consortia restore the composition of the gut microbiota. (A and B) Structure plot of the top 10 abundances at the species level in seven groups on day 8 or 14. Samples were ranked according to the increase in the relative abundance of the species most abundant in each group. (C and D) α-Diversity is represented by the box plot of the Simpson index on day 8 or 14. Statistics were calculated with a two-tailed Student's t test. N.S., not significant; *, P < 0.01. (E and F) The PCoA of β-diversity based on species-level microbiota as assessed by a Bray-Curtis matrix between seven groups on day 8 or 14. Different letters indicate statistical differences (P < 0.05) between the groups. (G and H) The PCoA of β-diversity based on species-level microbiota as assessed by a Bray-Curtis matrix between the probiotic consortia and control groups on day 8 or 14. (I and J) A heat map indicates the bacterial genus with significant differences (P < 0.05) between the probiotic consortia and control groups on day 8 or 14.

