FIG 4.
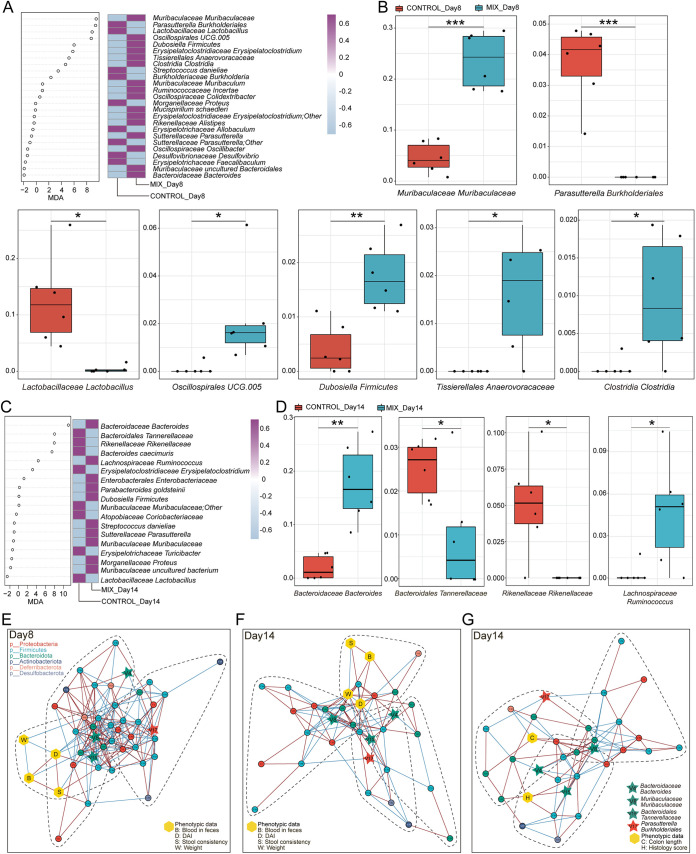
Identification of signature gut microbiota in colitis mouse model by random forest. (A) Mean decrease accuracy (MDA) was used to measure the relative abundance of each bacterium on day 8 at the species level in the predictive model. A heatmap depicts the comparison of bacteria in two groups filtered by random forest and 5-fold cross-validation (RFCV). (B) Relative abundance of seven taxa screened by random forest in the two groups on day 8. (C) RFCV models to predict biomarkers in the two groups on day 14. (D) Relative abundance of four taxa in the two groups on day 14. Statistical analysis was calculated with a two-tailed Student's t test. *, P < 0.05; **, P < 0.01, ***, P < 0.001. Data are presented as the mean ± SEM. (E to G) Cooccurrence network maps capture the complexity of network interactions between gut microbiota and phenotypic data on day 8 (E) or 14 (F and G). Nodes are colored according to the phylum they belong to. Edges are estimated by Spearman's rank correlation coefficient, a red line between nodes represents a positive correlation, and a blue line represents a negative correlation (P < 0.05).

