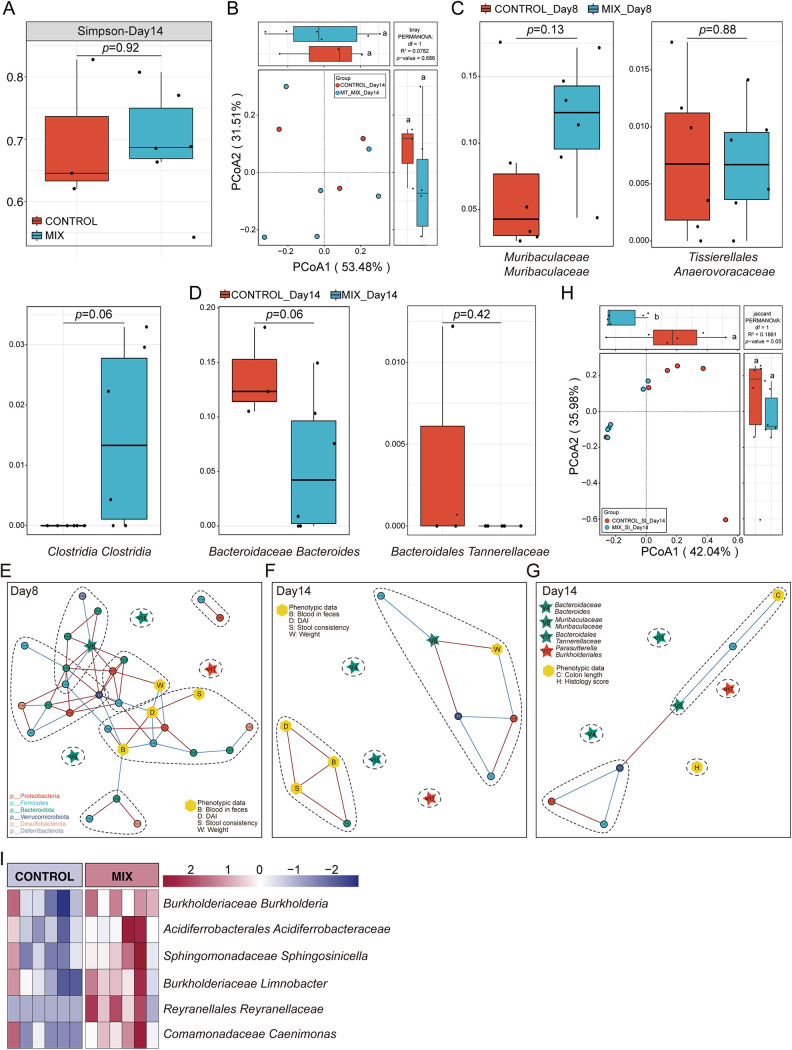
FIG 6.
Mixed-metabolite intervention in the DSS-induced colitis mouse model was inferior to mixed-strain intervention in terms of specific regulation of the gut microbiota. (A) α-Diversity (Simpson) in the mixed-metabolite and control groups for colon feces on day 14. (B) β-Diversity in the mixed-metabolite and control groups for colon feces on day 14. (C and D) Relative abundance of key bacteria screened by the mixed-strain intervention in the mixed-metabolite and control groups in colon feces on day 8 or 14. (E to G) Cooccurrence network map between key signature bacteria and phenotypic data for colon fecal samples on day 8 (E) or 14 (F and G). Nodes are colored according to the phylum to which they belong. Edges are estimated by Spearman's rank correlation coefficient, a red line between nodes represents a positive correlation, and a blue line represents a negative correlation (P < 0.05). (H) β-Diversity between mixed-metabolite group and control group in small intestinal contents on day 14. (I) Heatmap indicating bacteria with significant differences (P < 0.05) in small intestinal contents on day 14. Statistics were calculated with a two-tailed Student's t test. Data are presented as the mean ± SEM.

