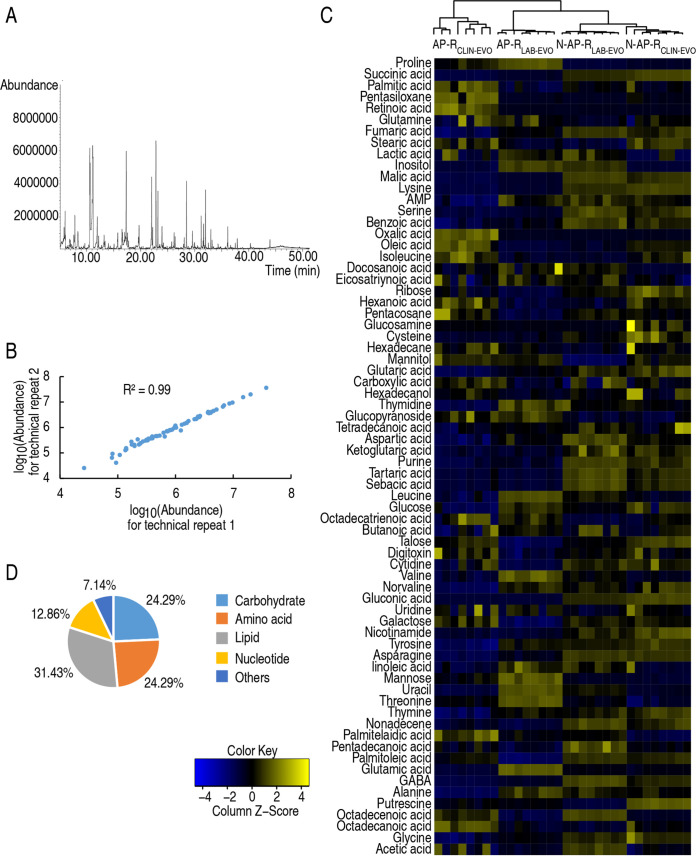
FIG 1.
Metabolic profiles between nitrite-induced metabolomics in AP-RCLIN-EVO and AP-RLAB-EVO. (A) Representative total ion current chromatogram. (B) Pearson correlation coefficient between technical replicates. (C) Heat map of unsupervised hierarchical clustering of all metabolites (row). Yellow and blue colors indicate increase and decrease of the metabolites scaled to mean and standard deviation of row metabolite level, respectively (see color scale). (D) Categories of all of the identified metabolites.

