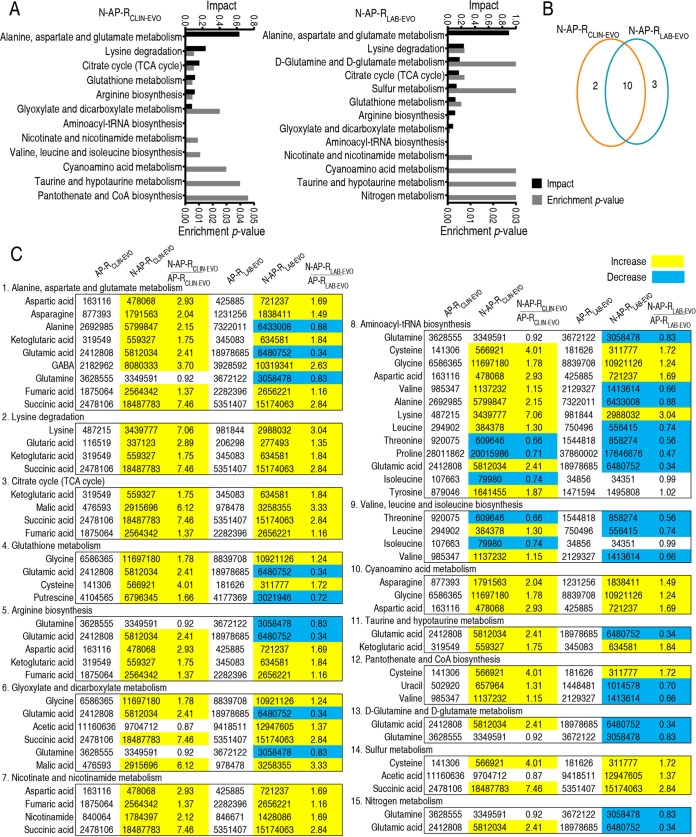
FIG 3.
Overlapped enriched pathways between N-AP-RCLIN-EVO and N-AP-RLAB-EVO. (A) Pathway enrichment of differential metabolites between N-AP-RCLIN-EVO and N-AP-RLAB-EVO. (B) Venn diagram for comparison of nitrite-induced pathways between N-AP-RCLIN-EVO (yellow color) and N-AP-RLAB-EVO (blue color). (C) Integrative analysis of metabolites in significantly enriched pathways. Yellow and blue colors indicate increased and decreased metabolites (P value <0.05), respectively.

