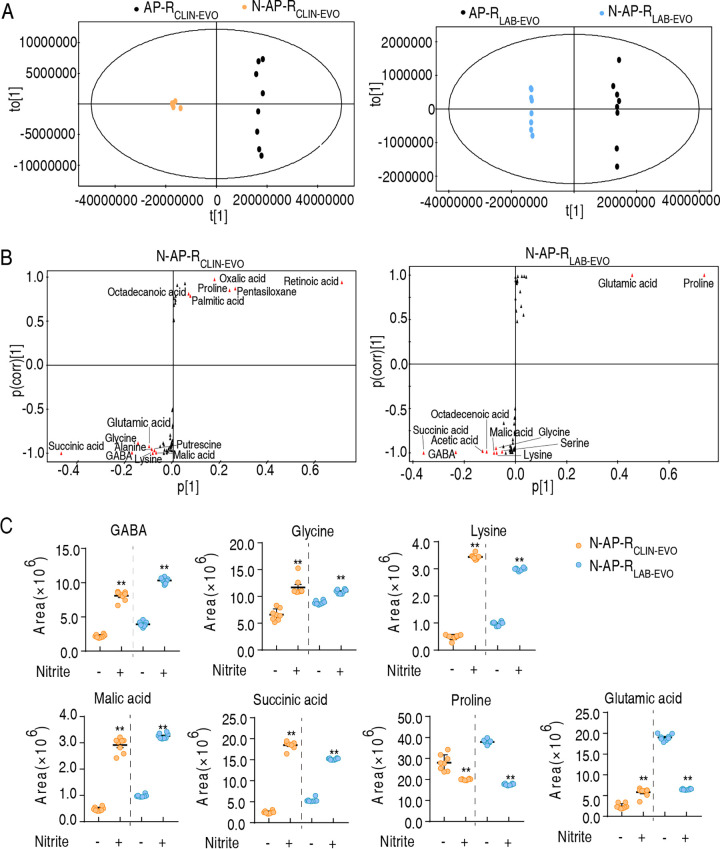
FIG 4.
Overlapped biomarkers between N-AP-RCLIN-EVO and N-AP-RLAB-EVO. (A) OPLS-DA of nitrite-induced metabolomes in AP-RCLIN-EVO (left) and AP-RLAB-EVO (right). Each dot represents the biological and technical replicate analysis of samples in the plot. (B) S-plot generated from OPLS-DA. Predictive component p [1] and correlation p(corr) [1] differentiate the nitrite-induced group from the control group in AP-RCLIN-EVO (left) and AP-RLAB-EVO (right). Triangles represents individual metabolites, where potential biomarkers are highlighted in red, which are greater or equal to 0.05 and 0.5 for absolute value of covariance p and correlation p(corr), respectively. Otherwise, triangles are marked in black. (C) The scatterplot of overlapped biomarkers of nitrite-induced metabolomes between N-AP-RCLIN-EVO and N-AP-RLAB-EVO. Results are displayed as mean ± SEM of four biological replicas and two technical replicates, and significant differences are identified: *, P <0.05; **, P < 0.01.

