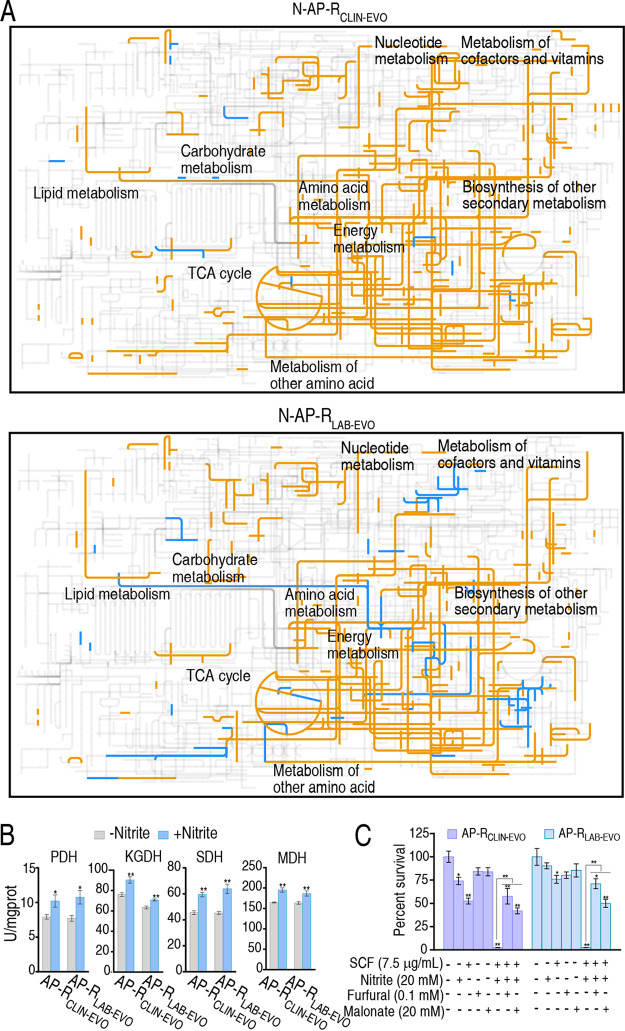
FIG 5.
iPath analysis and enzyme activity determination. (A) iPath analysis showing comparison of nitrite-induced metabolomes between N-AP-RCLIN-EVO and N-AP-RLAB-EVO. The yellow and blue lines mean upregulation and downregulation of metabolic pathways, respectively. (B) Activity of enzymes of PDH, KGDH, SDH, and MDH in the P cycle with or without nitrite (20 mM). (C) Percent survival of AP-RCLIN-EVO and AP-RLAB-EVO in the presence or absence of furfural or malonate plus SCF and nitrite. Result (C) is obtained using antibiotic bactericidal assay. Results are displayed as mean ± SEM of three biological replicas and significant differences are identified (*, P < 0.05; **, P < 0.01) as determined by two-tailed Student's t test (B) and analysis of variance (ANOVA) (C).

