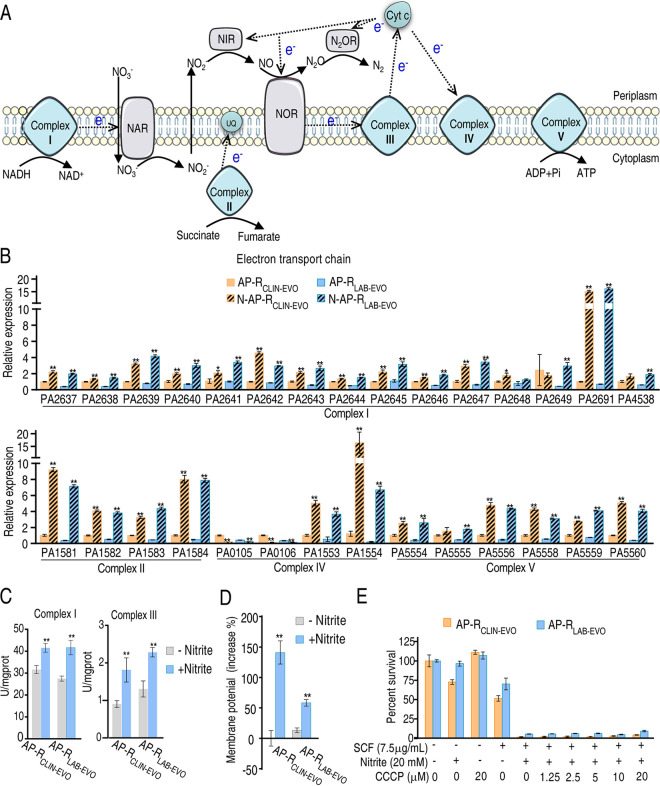
FIG 6.
Effect of nitrite on the electron transport chain. (A) Diagram showing electron transport chain. (B) qRT-PCR for expression of genes encoding electron transport chain in the presence of nitrite. (C) Activity of complex II and complex III in electron transport chain in the presence of nitrite (20 mM). (D) Membrane potential in the presence of nitrite. (E) Percent survival of AP-RCLIN-EVO and AP-RLAB-EVO in the presence or absence of the indicated doses of CCCP plus nitrite (20 mM) and SCF (7.5 μg/mL). Result (E) is obtained using antibiotic bactericidal assay. Results are displayed as mean ± SEM of three (C–E) or four (B) biological replicas, and significant differences are identified (*, P < 0.05; **, P < 0.01) as determined by two-tailed Student's t test.

