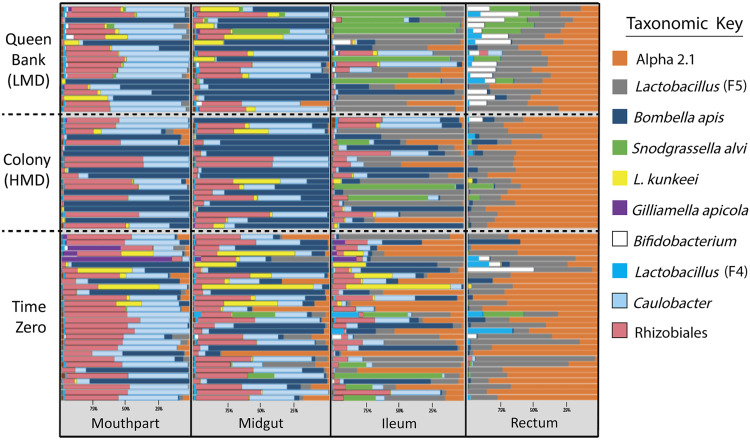
FIG 1.
Relative abundance of early queen microbiota by gut tissue and treatment. Color-coded bars represent relative abundance corrected by species-specific 16S rRNA gene copy number. The panel displays the 10 OTUs with greatest relative abundance by gut niche (x axis) and sampling environment (y axis). “Time zero” represents queens sampled upon receipt from the queen breeder prior to treatment conditions (n = 30), “colony” represents queens exposed to the colony environment for 3 weeks (n = 20) with high metabolic demand (HMD), and “queen bank” represents queens placed in queen banks for 3 weeks (n = 20) with low metabolic demand (LMD).

