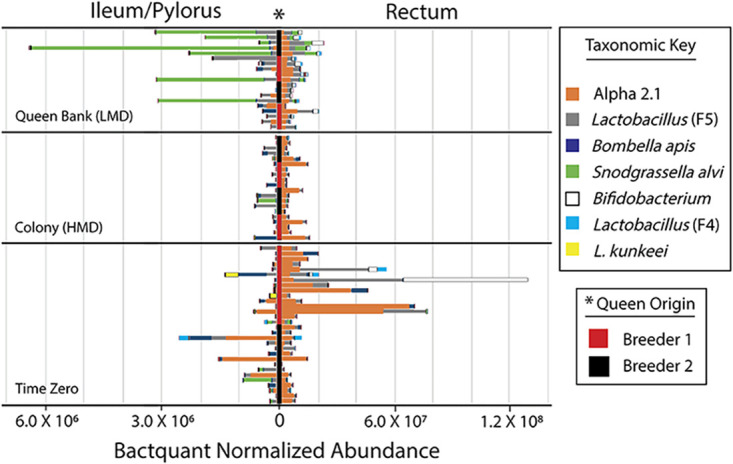
FIG 2.

Normalized microbiota abundance of the honey bee queen hindgut. Figure represents relative abundance normalized by BactQuant results and species-specific 16S rRNA gene copy number. The key lists the seven most abundant OTU’s presented by hindgut niche and sampling environment. Queen breeder is shown vertically in the center* of the figure as black or red. Note scale differences by hindgut tissue on the x axis. For comparison, the size of mouthpart and midgut microbiotas (not shown) averaged 1.8 × 10⁵ and 5.0 × 10⁵ 16S rRNA gene copies, respectively. Other details as in Fig. 1.
