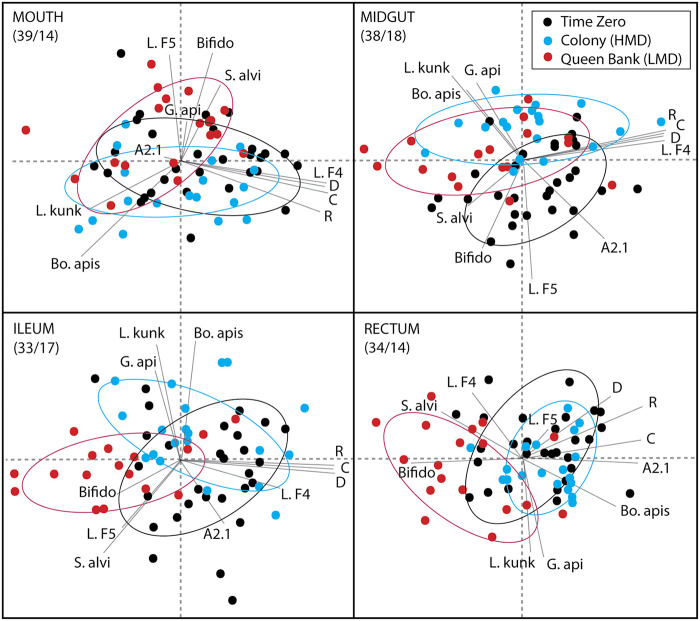
FIG 3.
Principal-component analysis by niche based on relative abundance of the top 11 OTUs. Data were transformed to log-ratio abundance among all OTUs using a centered log-ratio transformation prior to cluster analysis. The colored symbols in the top right box represent the sampling environment. Taxa in order of absolute abundance: Alpha 2.1 (A2.1); an unnamed Acetobacteraceae related to Commensilibacter, Lactobacillus firm5 (L.F5); a large and diverse phylotype composed of many species, Bombella apis (Bo. apis); a fungal inhibiting Acetobacteraceae that dominates social environments including the queen mouth and midgut, Snodgrassella alvi (S. alvi); a species intimately tied to worker ileum function, Lactobacillus kunkeei (L. kunk); queen- and worker- associated bacteria that populates social environments, Bifidobacterium (Bifido) and Lactobacillus firm4 (L. F4); both core rectum bacteria of workers, Gilliamella apicola (G. api); another highly diverse species group associated with worker ileum function; and finally, Delftia (D), Rhizobiales (R), and Caulobacter (C), three OTUs unknown in honeybees that require methodological validation. Percent variation explained by principal components (first/second) shown in upper left of each panel.

