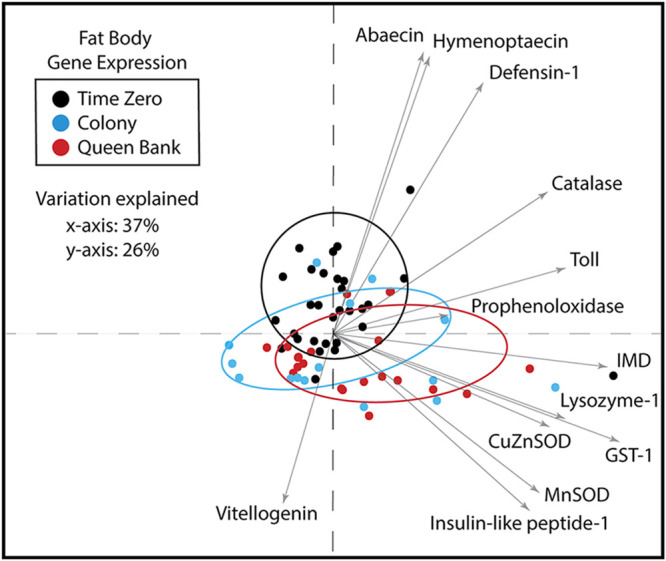
FIG 5.

Principal-component analysis of fat body gene expression. Sixty-three percent of the variation was explained by the first two principle components. Time one saw a significant increase in vitellogenin and insulin-like peptide-1 and a concurrent decrease of Toll and antimicrobial peptide expression independent of treatment. While colony queens had decreased catalase expression, queen bank queens increased expression of both SOD genes and GST-1 indicating increased oxidative stress.
