FIG 5.

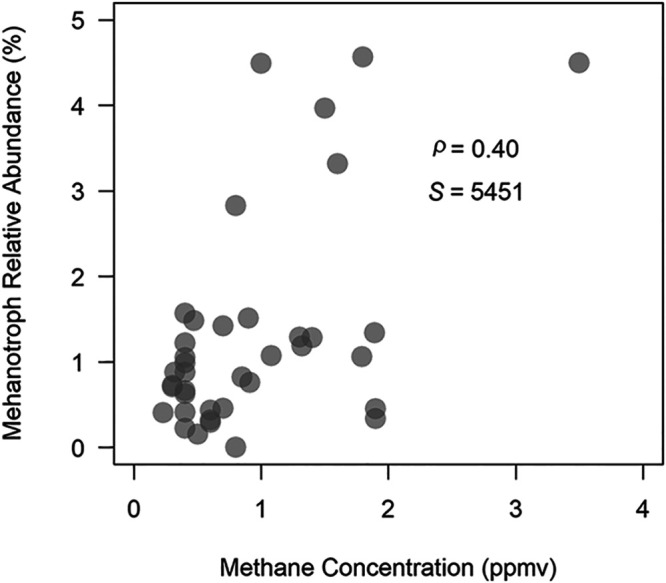
The relative abundance of members of the methanotrophic community plotted against the CH4 concentration at each sample location (ρ = 0.40, S-statistic: S = 5451, P < 0.01).

The relative abundance of members of the methanotrophic community plotted against the CH4 concentration at each sample location (ρ = 0.40, S-statistic: S = 5451, P < 0.01).