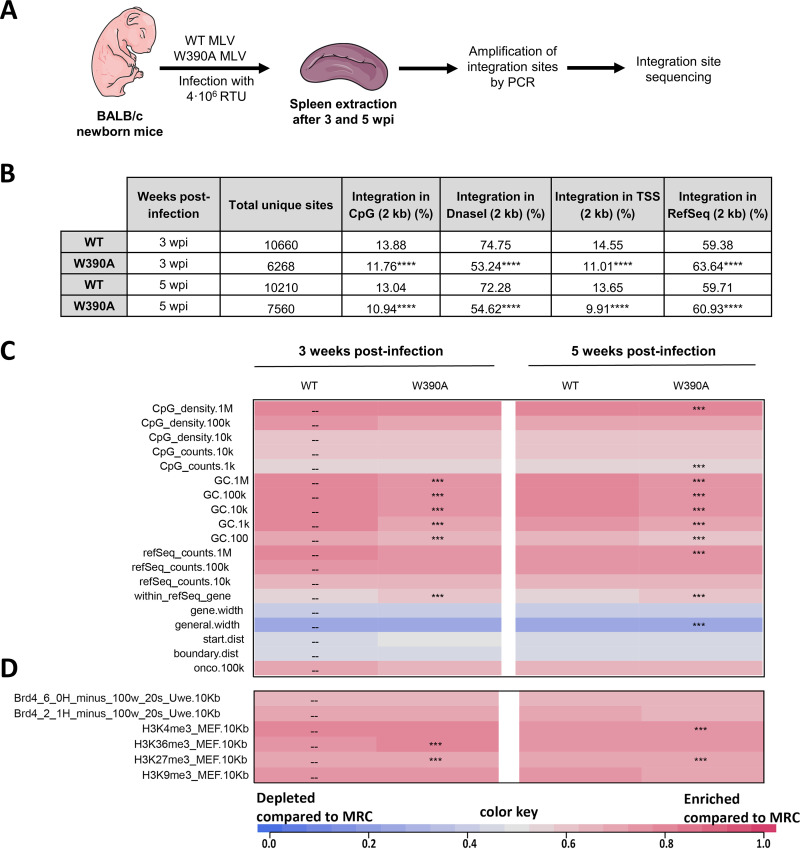
FIG 2.
Integration site analysis of WT MLV and W390A MLV in infected mice. (A) Schematic representation of the workflow to determine the integration sites and the epigenetic features of WT MLV and W390A MLV integrants in vivo. (B) Genomic distribution of MLV integration sites obtained from spleen cells of mice infected with either WT MLV or W390A MLV at 3 and 5 wpi. Integration percentages for 2-kb windows around CpG-rich island midpoints, DNase I-hypersensitive sites (DHSs), transcription start sites (TSSs), and RefSeq genes are given. Statistical analysis was done using a chi-squared test comparing integrations from WT MLV-infected mice with integrations from W390A MLV-infected mice (P ≤ 0.0001). (C and D) Heatmaps depicting the relationship between integration site frequency and different genomic (C) or epigenetic (D) features within a 10-kb interval in splenic cells from mice infected with either WT MLV or W390A MLV. The data shown are based on pooled samples from 3 mice infected with either WT MLV or W390A MLV. Features analyzed are shown to the left of the corresponding row of the heatmap. Colors indicate whether a particular feature is disfavored (blue) or favored (red) for the integration of the respective data sets relative to their computer-generated matched random controls (MRCs), as detailed in the color scale at the bottom. Significant departures from WT MLV integration sites in splenic cells are based on a Wald test, referred to as the χ2 distribution.

