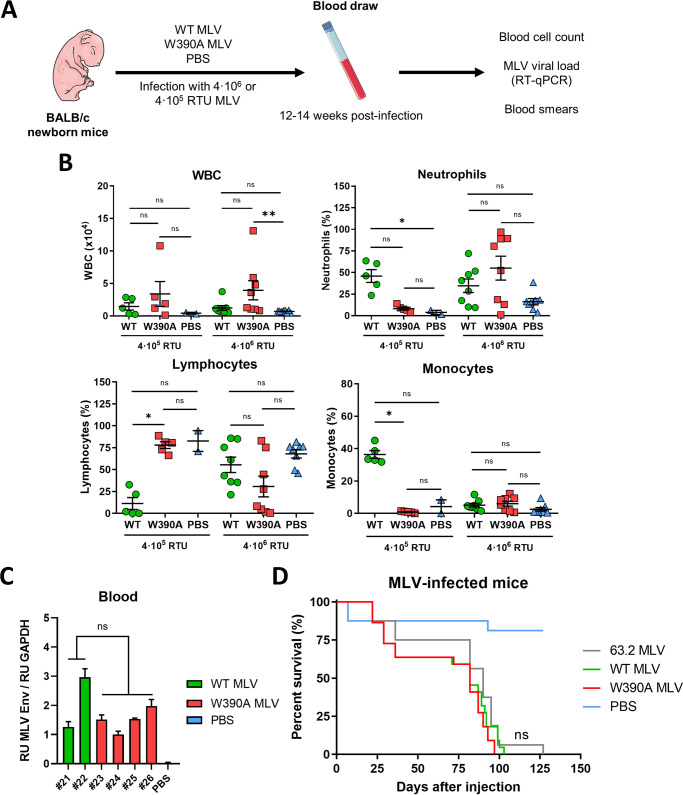
FIG 3.
Blood cell counts in WT MLV- and W390A MLV-infected mice. (A) Schematic representation of the workflow to evaluate the long-term effect of WT MLV and W390A MLV replication on blood cell numbers. Newborn mice were infected by intraperitoneal injection with 4 × 10⁵ RTU or 4 × 10⁶ RTU of either WT MLV or W390A MLV 1 day after birth. Blood was drawn between 80 and 90 days after injection. PBS was used as a negative control. (B) Number of WBCs in blood samples of mice infected with WT MLV (4 × 10⁵ RTU, n = 5; 4 × 10⁶ RTU, n = 8) or W390A MLV (4 × 10⁵ RTU, n = 5; 4 × 10⁶ RTU, n = 8) or injected with PBS (n = 2 and 8 for comparisons with 4 × 10⁵ RTU and 4 × 10⁶ RTU, respectively). Data correspond to the number of WBCs in 1 μL of blood. Percentages of neutrophils, lymphocytes, and monocytes in WBC samples are given for mice infected with WT MLV or W390A MLV. PBS injection was used as a negative control. Horizontal lines indicate means ± standard deviations (SD), while dots represent individual values. Statistical significance was analyzed using a Kruskal-Wallis test. (C) MLV loads measured by RT-quantitative PCR of the MLV Env gene normalized to GAPDH levels in samples of whole blood from mice infected with WT MLV or W390A MLV, taken at 21 days postinfection. Each bar represents an individual mouse. Standard deviations were calculated from technical duplicates. (D) Survival rates of mice infected with 63.2 MLV, WT MLV, or W390A MLV. Newborn mice were infected with 4 × 10⁶ RTU of each molecular clone diluted in a total volume of 50 μL PBS. Kaplan-Meier plots display the survival of mice infected with 63.2 MLV (n = 16), WT MLV (n = 22), or W390A MLV (n = 22). PBS was used as a negative control (n = 16). Each vertical step in the curve indicates one or more deaths. No statistically significant difference was found among 63.2 MLV, WT MLV, and W390A MLV using a Gehan-Breslow-Wilcoxon test.

